
Figure 6.
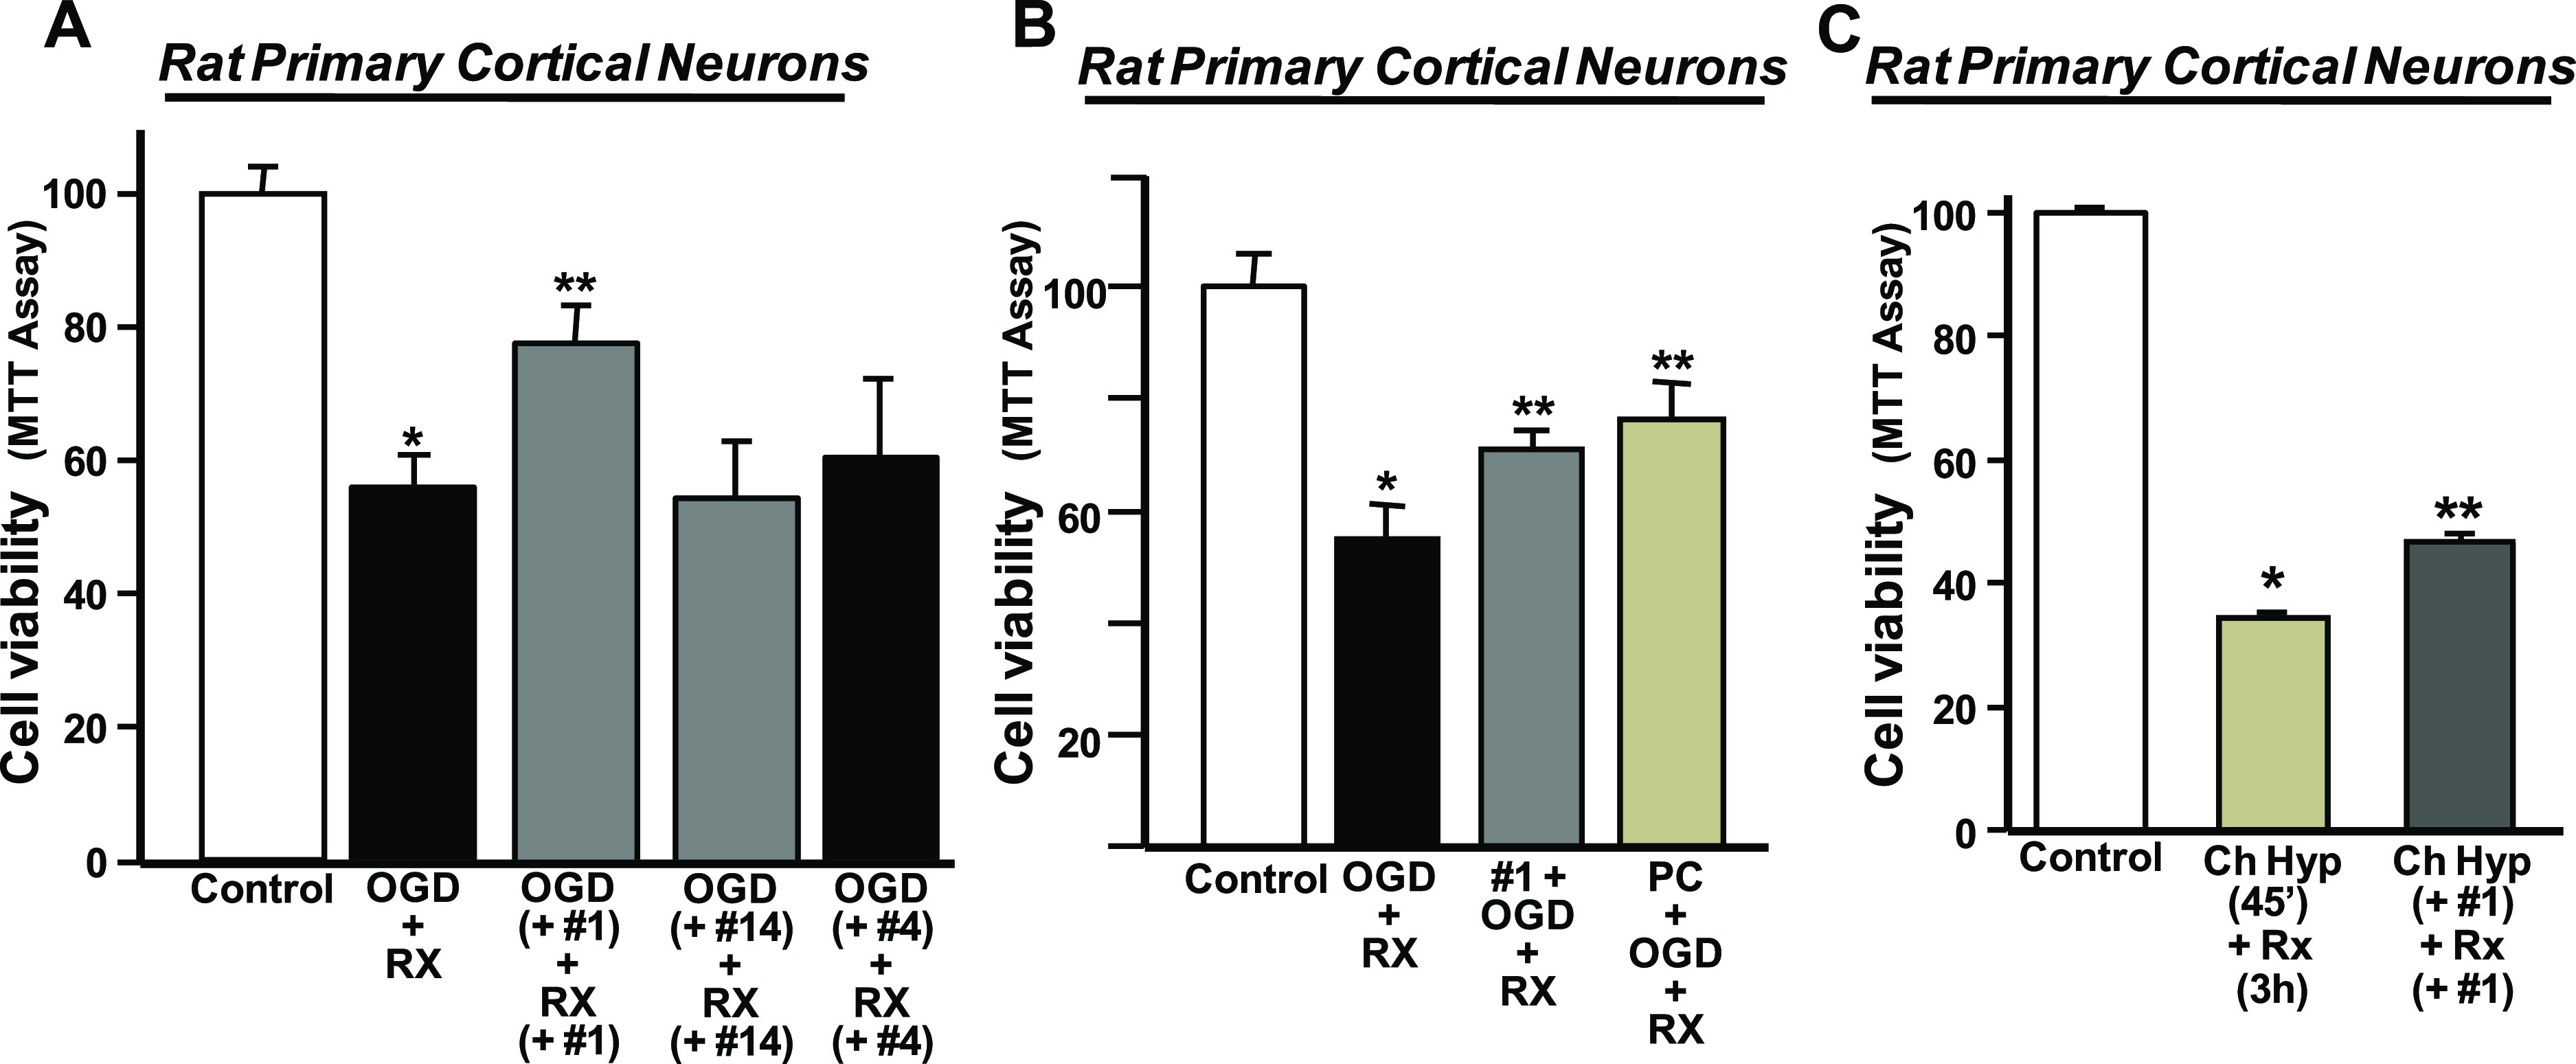
Neuroprotective effect of compound 1 in primary cortical neurons exposed to OGD followed by RX or chemical hypoxia followed by RX. (A) Bar graph depicting the effect on cell viability of compounds 1 (10 nM), 14 (10 μM), and 4 (10 μM) added during both OGD and RX. Cell viability was measured at the end of RX. Data are means ± SEM of five separate experiments and are reported as the percentage of cell viability in the control (100% viability). *p < 0.05 vs normoxic cells (control); **p < 0.05 vs OGD/Rx. (B) Bar graph depicting the effect on cell viability of compound 1 preincubated before OGD + RX. After preincubation, compound 1 was removed during OGD + RX and it was compared to ischemic PC. *p < 0.05 vs normoxic cells (control); **p < 0.05 vs OGD/Rx. (C) Bar graph depicting the effect on cell viability of compound 1 (10 nM) added during both chemical hypoxia (Ch Hyp, 45′) and RX (3 h). Cell viability was measured at the end of RX. Data are means ± SEM of three separate experiments and are reported as the percentage of cell viability in the control (100% viability). *p < 0.05 vs normoxic cells (control); **p < 0.05 vs Ch Hyp + Rx.