Figure S1.
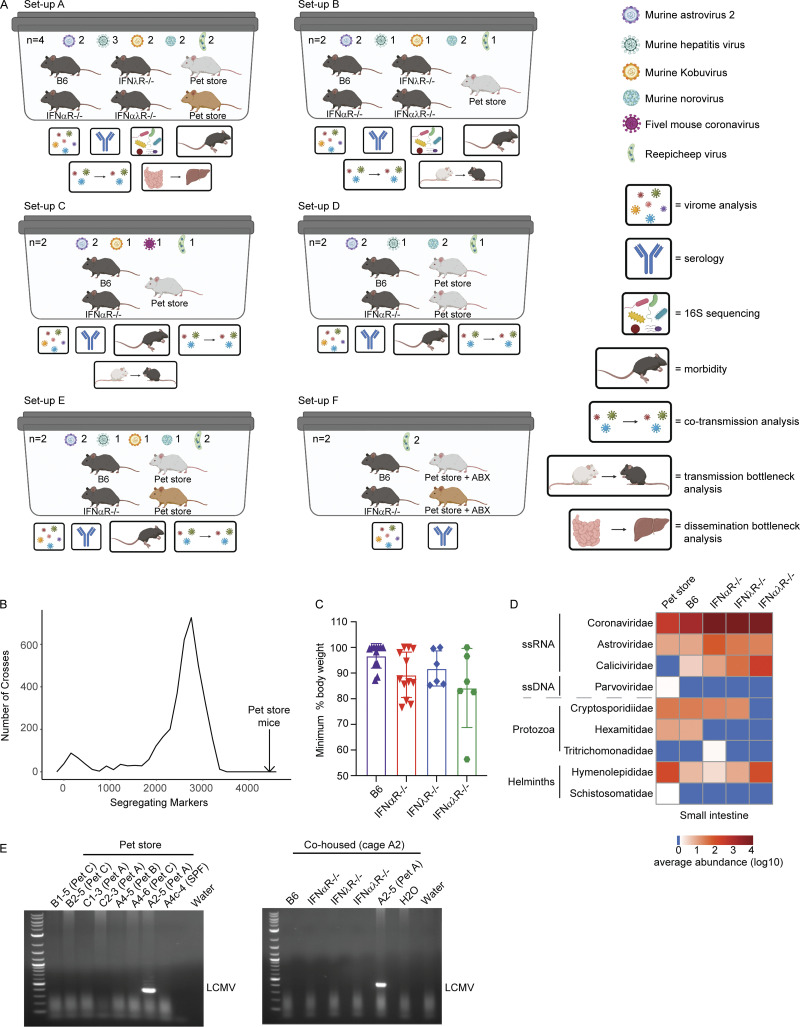
Overview of cohousing setups throughout paper, with expanded pet store genotyping, weight loss, and pathogen discovery data. (A) Models of each cage setup (labeled A–F) used in analyses. Key on the right denotes analyses performed on each cage. See Table S1 for details on which cohousing designs were used for each figure in the manuscript. Cohousing setup F was used only for characterizing pet store mouse serology and assembling the Reepicheep virus genome. (B) Data from miniMUGA genotyping array (Sigmon et al., 2020) that determined the number of segregating markers between 3,653 pairs of inbred strains presented as a frequency distribution (minimum segregating markers = 6, maximum = 3,351, median = 2,654, mean = 2,445). In the 18 pet store mice, the number of segregating markers was 4,431 (black arrow), greatly exceeding these pairwise comparisons of diversity. (C) Maximum weight loss after cohousing. (D) Heatmap of virus reads as quantified using CCMetagen. (E) Specific amplification and identification of arenavirus RNA in pet store (top) and cohoused (bottom) mice. Data combined from D, n = 12 cages. ABX, antibiotics; LCMV, lymphocytic choriomeningitis virus.

