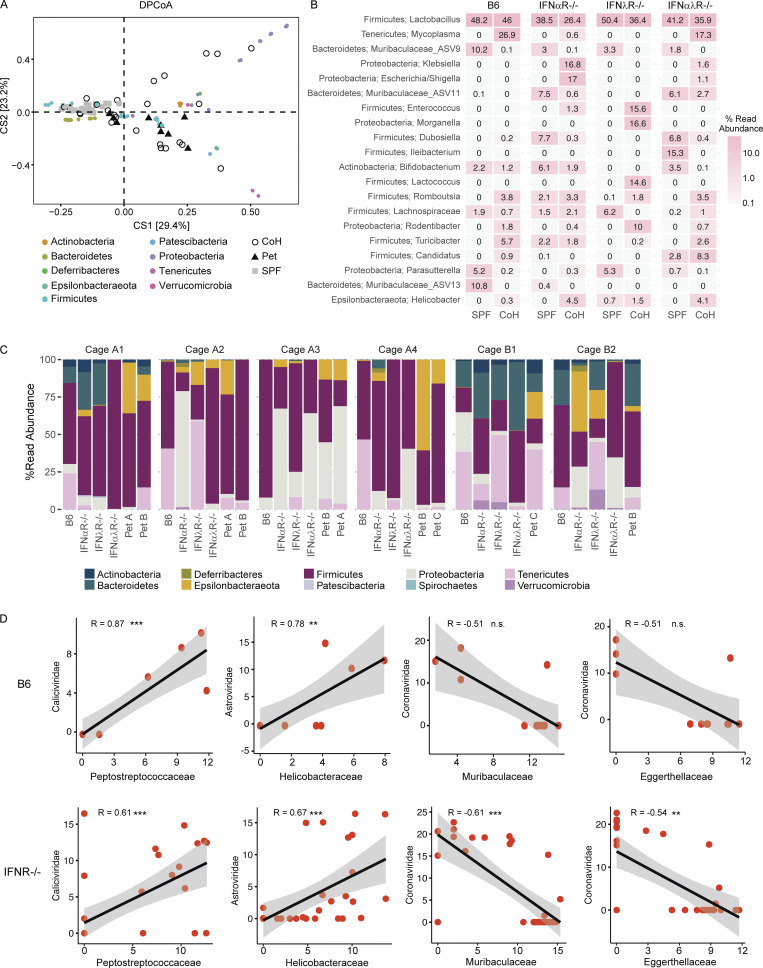
Figure S2.
Bacterial abundance and correlations in cohoused mice. (A) DPCoA biplot analysis of small intestine contents from un-cohoused SPF, cohoused SPF, and pet store mice. (B) Mean relative abundance of the 20 most abundant bacterial genera in un-cohoused SPF versus cohoused (CoH) SPF mice. (C) Relative abundance of bacterial phyla in each individual cohoused mouse separated by cage. (D) Correlation of normalized bacterial family read abundance in B6 versus IFNR−/−. Data combined from n = 6 cages (A–C) and n = 12 cages (D). Statistical significance determined by Spearman’s correlation (D). n.s., P > 0.05; **, P < 0.01; *** P < 0.001. Reported P values in D (left to right): 0.00046, 0.0043, 0.11, 0.11 (top) and 0.00018, 2.1 × 10⁻⁵, 0.00016, 0.0013 (bottom).

