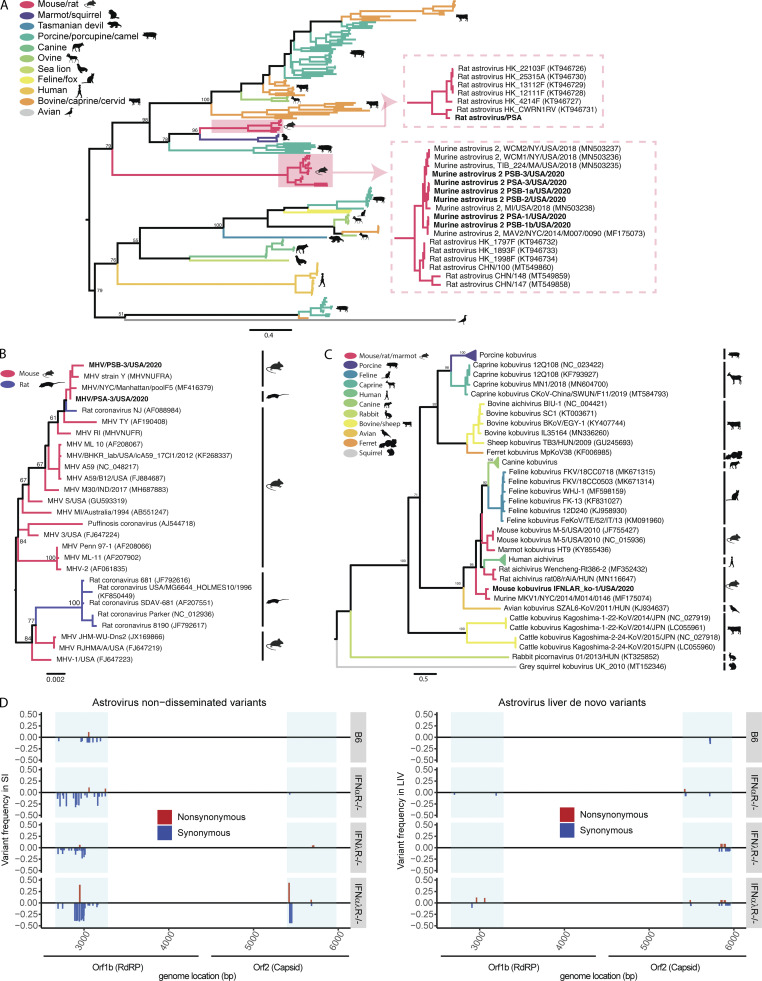
Figure S4.
Astrovirus, MHV, and Kobuvirus phylogeny and variant analyses. (A–C) Phylogenetic relationships of astrovirus ORF2 amino acid sequences (A), MHV nucleocapsid amino acid sequences (B), and Kobuvirus partial whole-genome amino acid sequences (C). Branches are colored by host species; bootstrap percentages (of 500 replicates) are shown at major nodes. (D) Genome position and relative frequency of murine astrovirus 2 SNVs during dissemination. Genome position is shown on the x axis, with blue boxes highlighting areas where amplicons were generated. Relative frequencies are measured as a fraction of the SNV of all nucleotide reads per position. Nonsynonymous SNVs are colored red and shown with a positive frequency, while synonymous SNVs are colored blue and shown with a negative frequency. Data combined from D, n = 2 cages. LIV, liver; SI, small intestine.

