Figure 2.
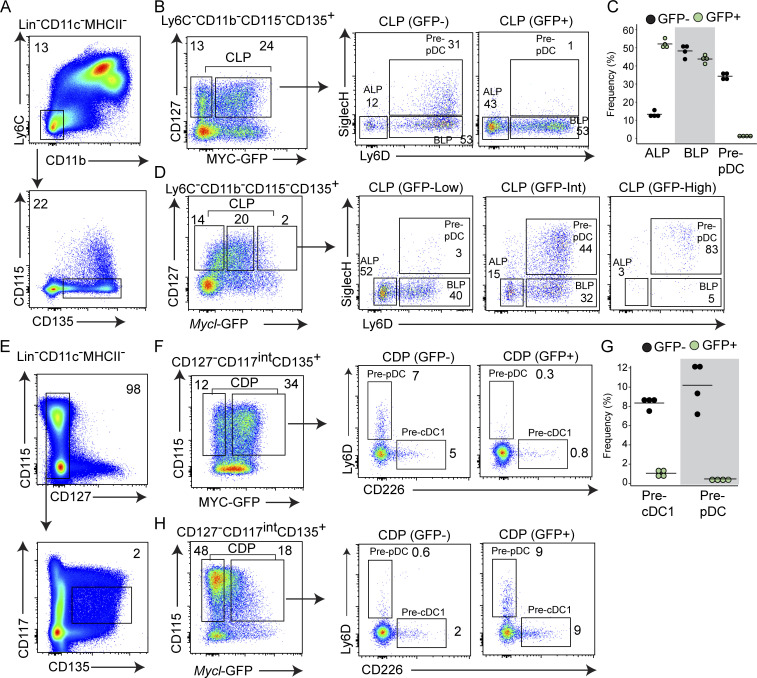
The switch from MYC to MYCL expression occurs within the CDP and CLP on pre-cDC1 and pre-pDC specification. (A) Representative pregating scheme for flow cytometry analysis of BM CLPs (Lin−CD11c−MHCII−Ly6C−CD11b−CD115−CD135+CD127+) from MycGFP/GFP and MyclGFP/GFP mice. (B and C) Frequency of ALPs (SiglecH−Ly6D−), BLPs (SiglecH−Ly6D+), and pre-pDCs (SiglecH+Ly6D+) within MYC-GFP− and MYC-GFP+ CD127+ CLPs from MycGFP/GFP mice, gated as in A. (B) Representative plot. (C) Data from four samples pooled from two independent experiments. (D) Frequency of ALPs, BLPs, and pre-pDCs within Mycl-GFPlow, Mycl-GFPint, and Mycl-GFPhigh CLPs from MyclGFP/GFP mice, as gated in A. (E) Representative pregating scheme for flow cytometry analysis of BM CD115+ CDPs (Lin−CD11c−MHCII−CD127−CD135+CD117int) from MycGFP/GFP and MyclGFP/GFP mice. (F and G) Frequency of pre-cDC1s (CD226+Ly6D−) and pre-pDCs among MYC-GFP− and MYC-GFP+ CD115+ CDPs. (F) Representative plot. (G) Data from four samples pooled from two independent experiments. (H) Frequency of pre-cDC1s (CD226+Ly6D−) and pre-pDCs among Mycl-GFP− and Mycl-GFP+ CD115+CDPs. Numbers inside flow cytometry panels quantify the frequency of indicated populations as a percentage of the parent gate.

