Figure S5.
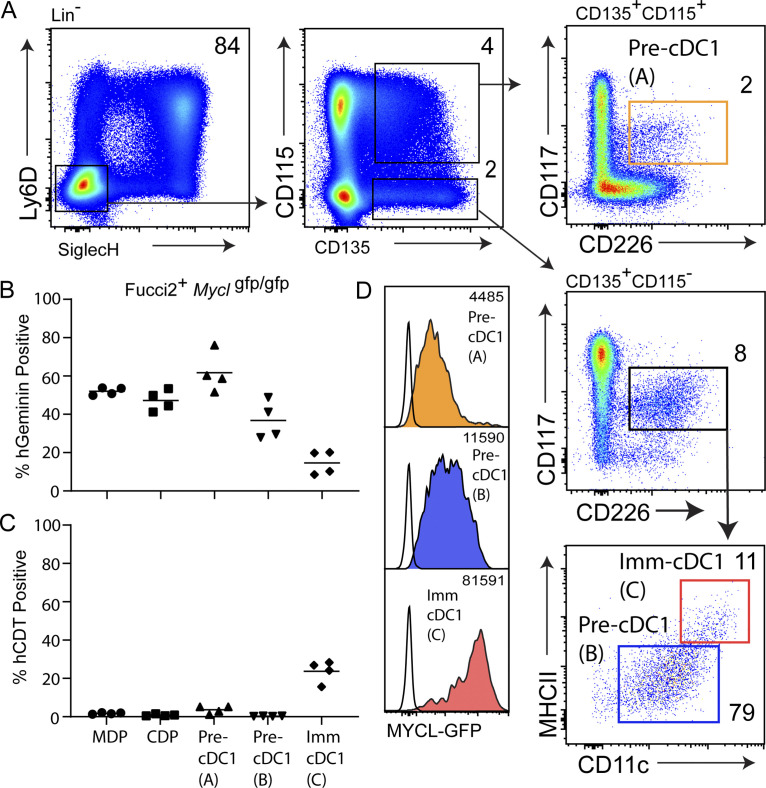
Reduced cell cycling and high Mycl-GFP expression correlate with commitment of pre-cDC1s to immature cDC1s. (A) Representative gating scheme for flow cytometry analysis of cDC1s and cDC1 precursors in the BM of Fucci2+Myclgfp/gfp mice. (B and C) Cell cycle analysis on the basis of Geminin-Venus and CDT-mCherry expression, quantified as illustrated in Fig. 2. (D) Mycl-GFP expression for the indicated populations. Histograms are color-coded and correspond to gated populations as defined in A. Numbers inside flow cytometry panels quantify the frequency of indicated populations as a percentage of the parent gate. All data are representative of two independent experiments (n = 4). Pre-cDC1 (A), labeled in orange, defined as Lin−Ly6D−SiglecH−CD135+CD115+CD117intCD226+; pre-cDC1 (B), labeled in blue, defined as Lin−Ly6D−SiglecH−CD135+CD115−CD117intCD226+CD11c+MHCIIint; immature (Imm) cDC1, labeled in red, defined as Lin−Ly6D−SiglecH−CD135+CD115−CD117intCD226+CD11chighMHCIIhigh.

