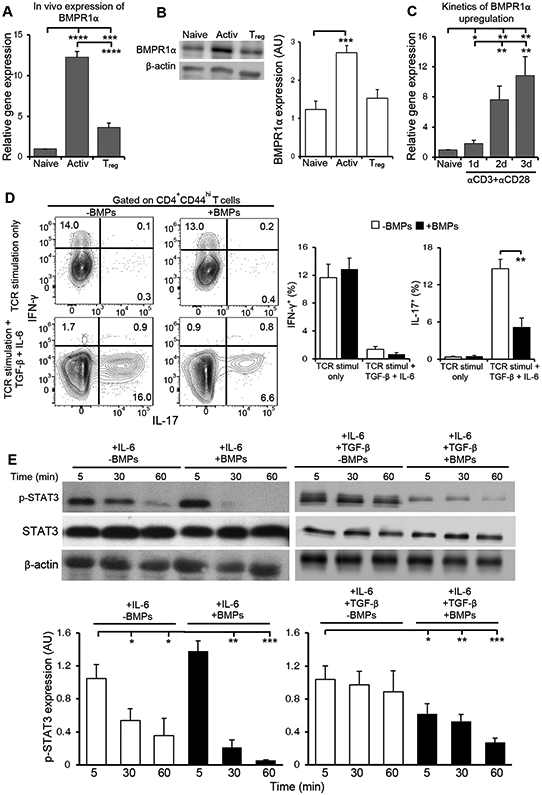
Fig. 1. BMP signaling regulates T cell activation and lineage commitment.

(A) qRT-PCR analysis of BMPR1α mRNA expression in sorted CD4+ naive, activated and Treg cells. Data are means ± SD pooled from 3 independent sorts. (B) Western blot analysis of BMPR1α abundance in lysates from sorted CD4+ naive, activated and Treg cells. Blots (left) are representative of three independent experiments. Normalized band intensity data (right) are means ± SD pooled from all experiments. (C) qRT-PCR analysis of BMPR1α in sorted, naive CD4+ T cells stimulated with antibodies against CD3 and CD28 for the indicated times. Results are means ± SD pooled from three independent experiments. (D) Flow cytometry analysis of IFN-γ and IL-17 in CD4+ T cells stimulated with antibodies against CD3 and CD28 for 4 days and BMP2/4/7 or TGF-β and IL-6, as indicated. Dot plots (left) representative of four independent stimulations. The frequency of cytokine producing cells (right) are means ± SD pooled from all experiments. (E) Western blot analysis of p-STAT3 and STAT3 in CD4+ T cells stimulated for the indicated times with IL-6 or IL-6 and TGF-β in the absence or presence of BMP2/4/7. Blots (top) are representative of four independent experiments. Normalized band intensity data (bottom) are means ± SD pooled from all experiments. *P<0.05, **P< 0.01, ***P< 0.001, ****p< 0.0001 as determined by Student’s t- test.
