
Fig. 2. BMPR1α restricts CD4+ T cells IL-17 production.
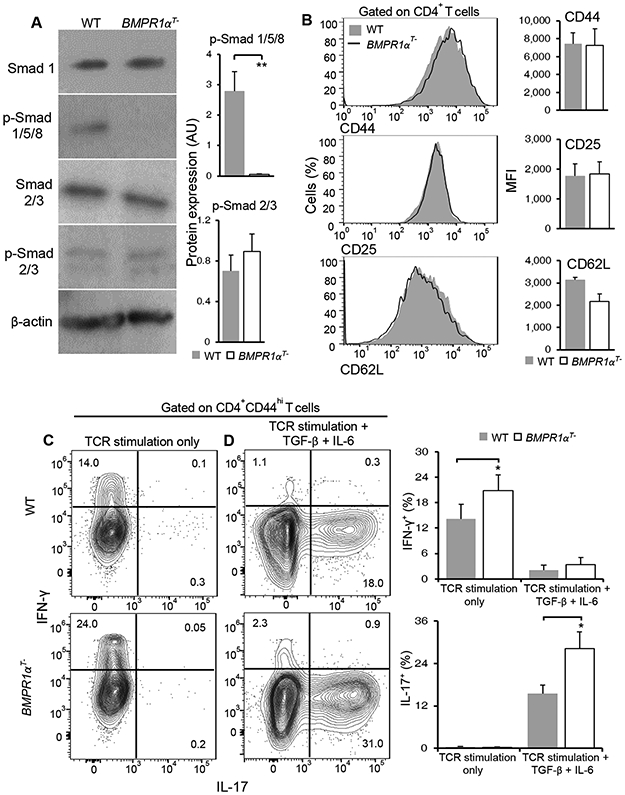
(A) Western blot analysis of total and phosphorylated Smad1/5/8 and Smad 2/3 in activated wild-type (WT) and BMPR1αT− CD4+ T cells. Blots (left) are representative of three independent experiments. Normalized band intensity data (right) are means ± SD pooled from all experiments. (B) Flow cytometry analysis of the indicated cell surface markers on activated WT and BMPR1αT− CD4+ T cells. Histograms (left) are representative of four independent analyses. Mean florescence intensity (MFI) data (right) are means ± SD from all experiments. (C and D) Flow cytometry analysis of cytokine production by CD4+ T cells from WT and BMPR1αT− mice stimulated with antibodies against CD3 and CD28 in medium alone (C), or in the presence of TGFβ and IL-6 (D), as indicated. Contour plots are representative of four independent stimulations. The frequency of cytokine producing cells are means ± SD pooled from all experiments. *P<0.05, **P< 0.01, as determined by Student’s t-test.