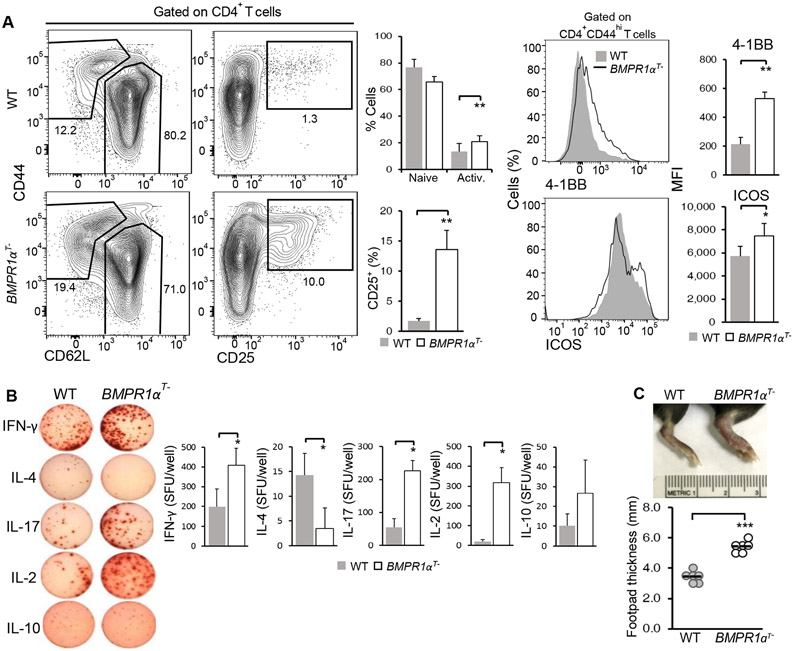
Fig. 3. BMPR1α reduces the generation of pro-inflammatory CD4+ T cells in vivo.
(A) Flow cytometry analysis of the indicated activation markers on CD4+ T cells isolated from the popliteal lymph nodes of WT and BMPR1αT− mice injected with CFA in the footpad and analyzed after 5 days. Contour plots are representative of three independent experiments. The frequency of naive, activated, and CD25+ cells and activation marker MFI are means ± SD from all experiments. (B) ELISPOT analysis of cytokine production by T cells isolated from WT and BMPR1αT− mice 7 days after booster immunization with class II MHC restricted LCMV gp61-80 peptide in CFA. Images (left) were quantified spot forming units (SFU). Quantified data (right) are means ± SD pooled from three independent experiments. (C) Analysis of footpad thickness in WT and BMPR1αT− mice injected with CFA in the footpad and analyzed after 5 days. Images (top) are representative of three independent experiments. Quantified data (bottom) are means ± SD pooled from all experiments. *P< 0.05, **P< 0.01, ***P< 0.001, as determined by Student’s t-test.

