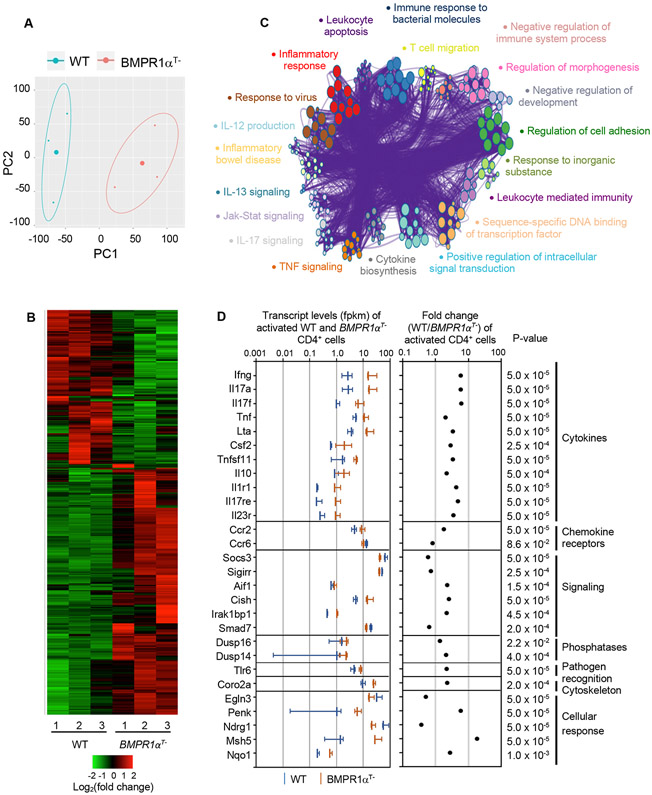
Fig. 5. BMPR1α alters Th1/Th17 gene expression.
(A) Principal component analysis of genes expressed by activated BMPR1α-sufficient and -deficient CD4+ T cells. Analysis included gene expression data from three samples of BMPR1α-sufficient and -deficient cells. (B) Genes differentially expressed in activated CD4+ T cells from WT and BMPR1αT− mice. Analysis included genes differentially expressed between three samples of BMPR1α-sufficient and - deficient cells. Colors show log2 fold change of the expression difference. (C) Metascape GO analysis of genes differentially expressed by activated WT and activated BMPR1α-deficient CD4+ T cells. (D) Transcript levels, fold change expression and p-values of genes differentially expressed in activated CD4+ T cells from WT and BMPR1αT− mice, related to inflammatory, immune and metabolic responses. Vertical bars represent average values of gene expression levels (fpkm) ± SD. All data are representative of three biological replicates.

