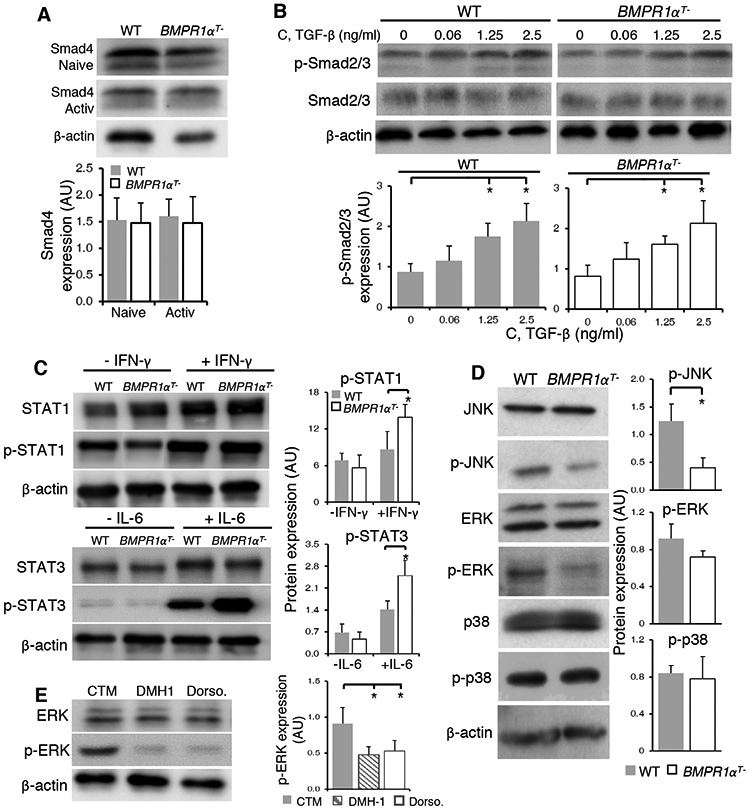
Fig. 6. BMPR1α mediates TCR and cytokine-dependent signaling.

(A) Western blot analysis of Smad4 in naive and activated CD4+ T cells. Blots (top) are representative of four independent experiments. Normalized band intensity data (bottom) are means ± SD from all experiments. (B) Western blot analysis of total and phosphorylated Smad 2/3 in CD4+ T cells from WT and BMPR1αT− mice stimulated for 1 hour with plate-bound antibodies against CD3 and CD28 in the presence of indicated concentrations of TGF-β. Blots (top) are representative of four independent stimulations. Normalized band intensity data (bottom) are means ± SD from all experiments. (C) Western blot analysis of STAT1 and STAT3 phosphorylation in lysates from WT or BMPR1αT− CD4+ T cells directly isolated and lysed (−IFN-γ and −IL-6) or activated for 5 min with plate-bound antibodies against CD3 and CD28 in the presence of IFN-γ or IL-6. Blots (left) are representative of four independent experiments. Normalized band intensity data (right) are means ± SD from all experiments. (D) Western blot analysis of Jnk, Erk and p38 phosphorylation in lysates from WT or BMPR1αT− CD4+ T cells activated with Con A for 2 days. Blots (left) are representative of four independent experiments. Normalized band intensity data (right) are means ± SD from all experiments. (E) Western blot analysis of Erk phosphorylation in WT CD4+ T cells activated with plate-bound antibodies against CD3 and CD28 in the presence of inhibitors DMH1 or dorsomorphin for 24 hours. Blots (left) are representative of three independent experiments. Normalized band intensity data (right) are means ± SD from all experiments. *P< 0.05, as determined by Student’s t-test.
