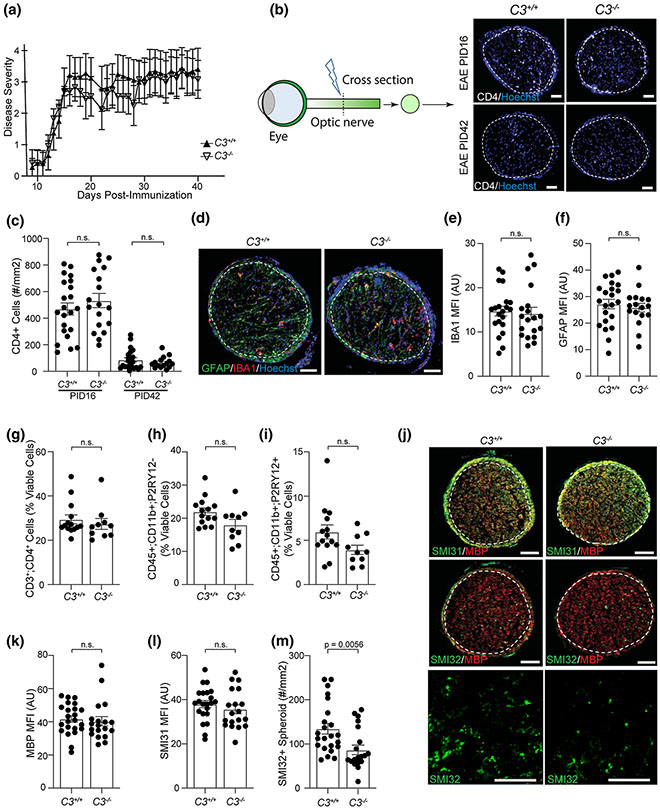
Fig. 3.
C3 deletion does not affect EAE behavioral score, effector T cell infiltration into the optic nerve, or demyelination but reduces axonal swellings. a Behavior score of EAE mice over time from one representative experiment (C3+/+ EAE, n = 8; C3−/− EAE, n = 6). The experiment was replicated 5 times (across all 5 replicate experiments, C3+/+ EAE, n = 108; C3−/− EAE, n = 91). b Representative images of CD4+ T-cell staining in the cross sections of optic nerve from EAE mice, 20 × magnification; Scale bar = 50 μm. c Quantification of CD4+ T-cells in the optic nerves of EAE mice at PID16 and PID42. d Representative images of GFAP and IBA1 staining in optic nerves of EAE mice at PID16, 20 × magnification, Scale bar = 50 μm. e–f Quantification of IBA1 e and GFAP f staining in optic nerves of EAE mice at PID16, presented as MFI. AU arbitrary unit. g–i The percentage of CD3+CD4+ T cells g, infiltrating myeloid cells (CD11b + ;P2RY12−) h, and microglia (CD11b + ;P2RY12 +) i in the brain of EAE mice at PID16, quantified by flow cytometry in the population of viable cells. j Representative images of SMI31/MBP and SMI32/MBP staining in the optic nerve of EAE mice at PID16. The last row shows the magnified images of SMI32; Scale bar = 50 μm. k–l Quantification of MBP and SMI31 staining in the optic nerve of EAE mice at PID16, presented as MFI. m The counts of SMI32+ spheroids in the optic nerve of EAE mice at PID16. Significance between groups was assessed by unpaired t-test. Error bars represent SEM. In all quantifications, each dot represents a unique mouse

