
Fig. 4. PK for P4/TSA treatment.
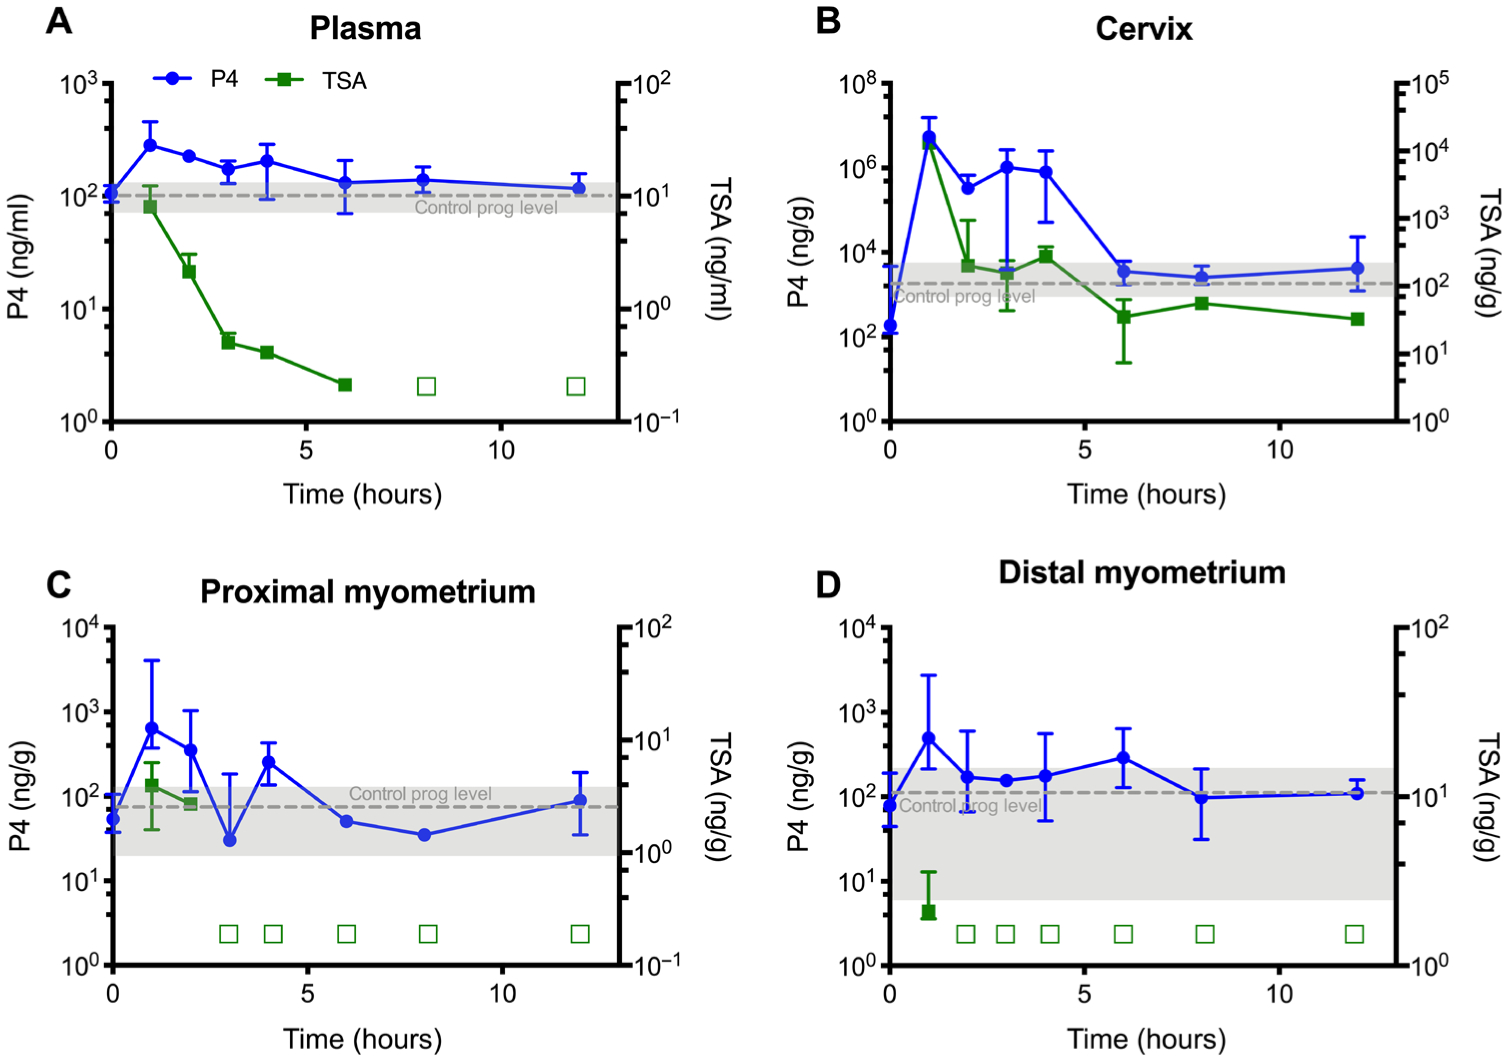
P4 (left axis) and TSA (right axis) concentrations in (A) plasma, (B) cervical tissue, (C) proximal myometrial tissue, and (D) distal myometrial tissue collected from healthy dams after a single vaginal P4/TSA NS dose on E15. An empty square symbol indicates that TSA concentrations in all samples were below the lower limit of quantification (0.2 ng/ml or ng/g) at that time point. Gray dashed lines represent mean endogenous concentrations of P4 from untreated healthy E15 dams. Data are presented as median ± interquartile range (n = 3).