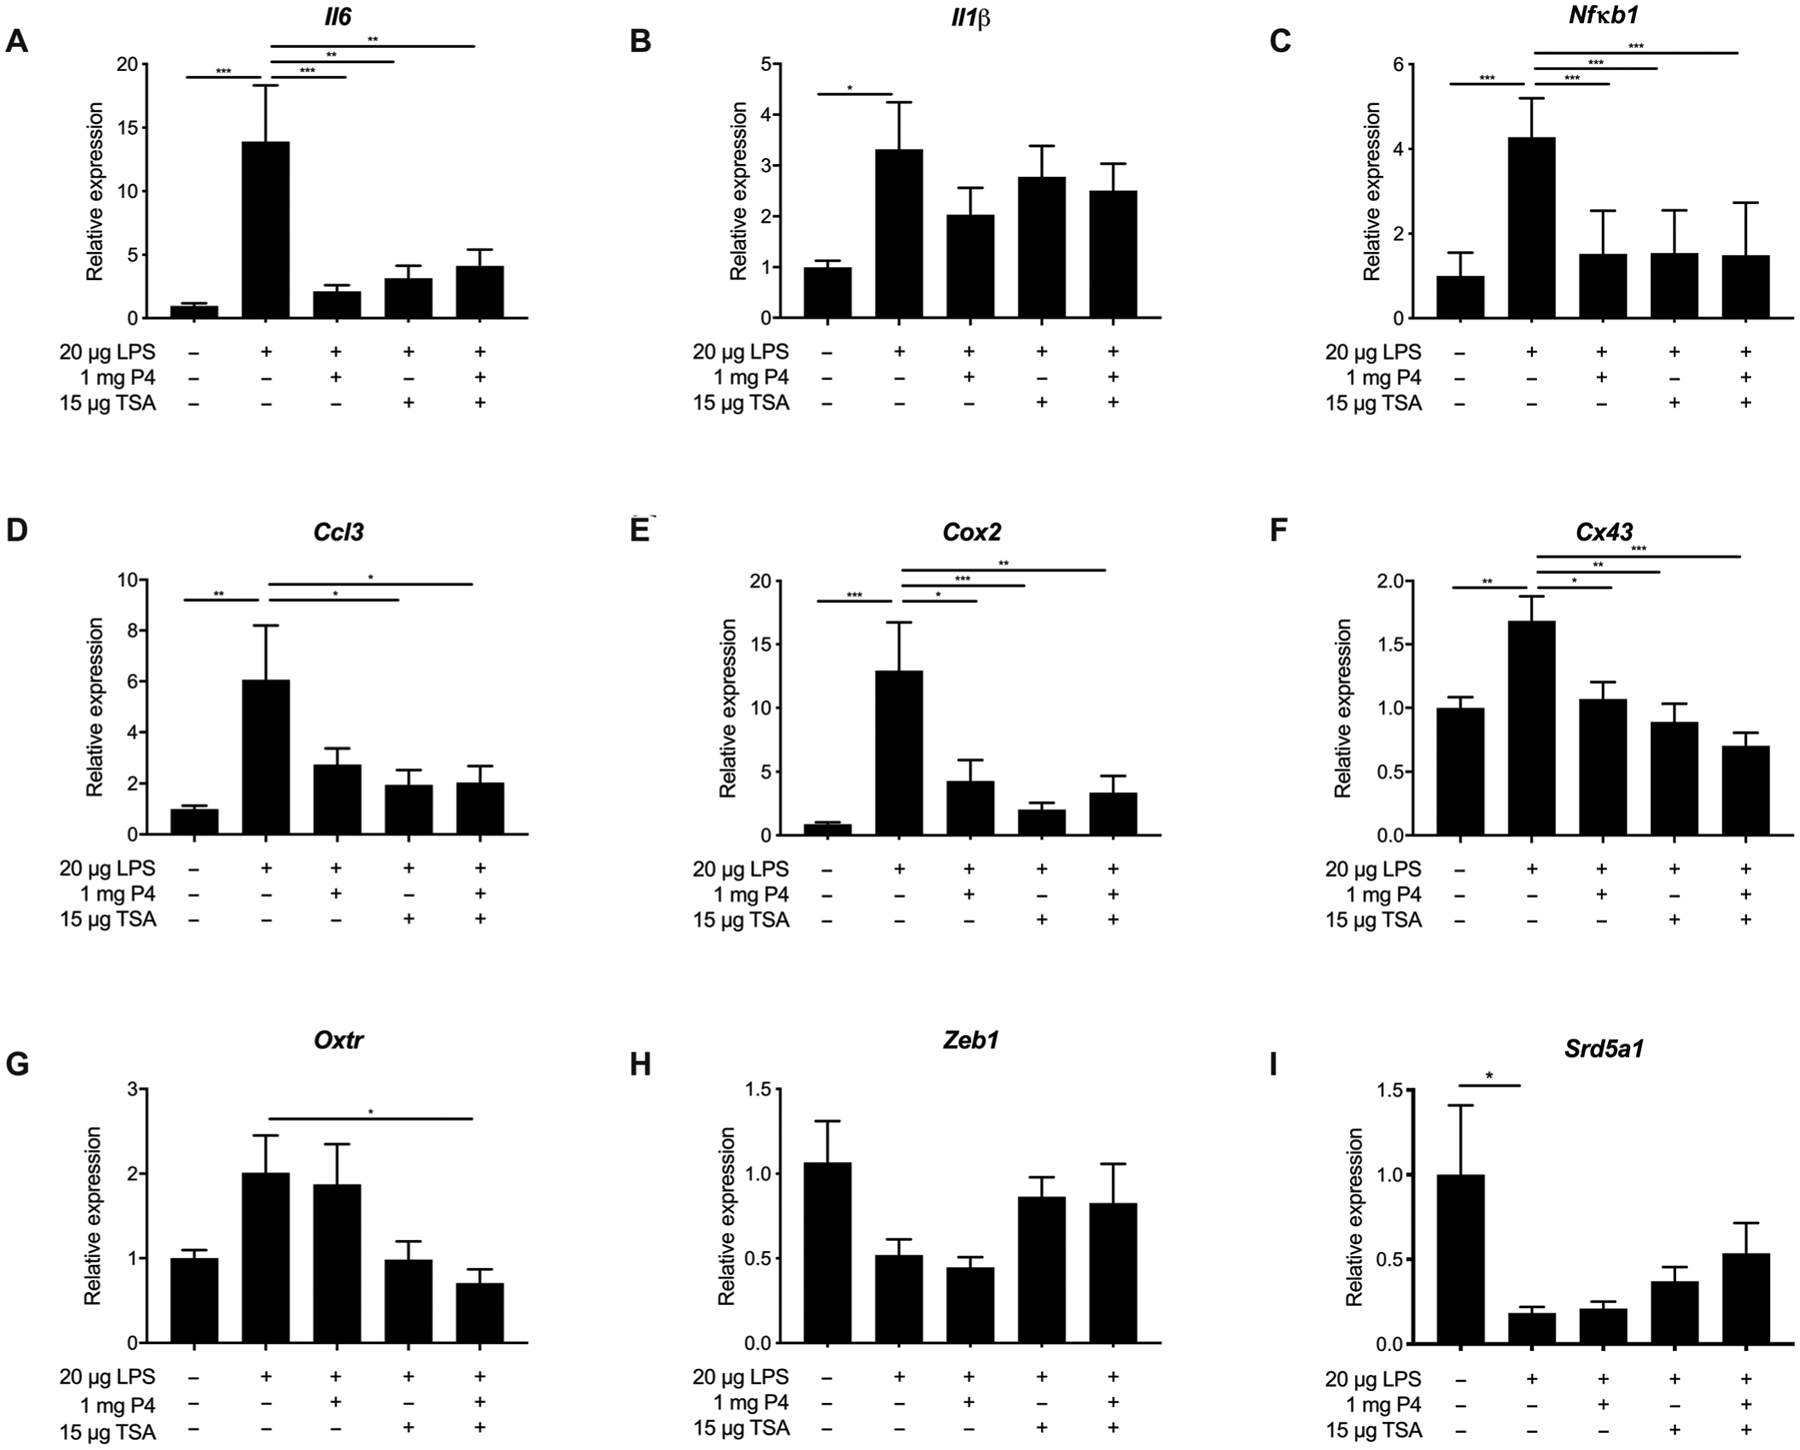
Fig. 5. Myometrial gene expression in different treatment groups.

Relative gene expression for (A) Il6, (B) Il1β, (C) Nfκb1, (D) Ccl3, (E) Cox2, (F) Cx43, (G) Oxtr, (H) Zeb1, and (I) Srd5a1 in myometrial tissue from dams receiving DDI of saline or DDI of LPS with no treatment, vaginal P4 NS (1 mg), TSA NS (15 μg), or P4/TSA NS (1 mg/15 μg). Gene expression was analyzed using the ΔΔCT method, using Rplp0 as the housekeeping gene. Results are presented as expression relative to that in the saline sham– treated group. Data are shown as means ± SEM (n ≥ 8). *P < 0.05, **P < 0.01, and ***P < 0.001
