
Fig. 2. CSPG4.CAR-Ts target GBM-NS in vitro.
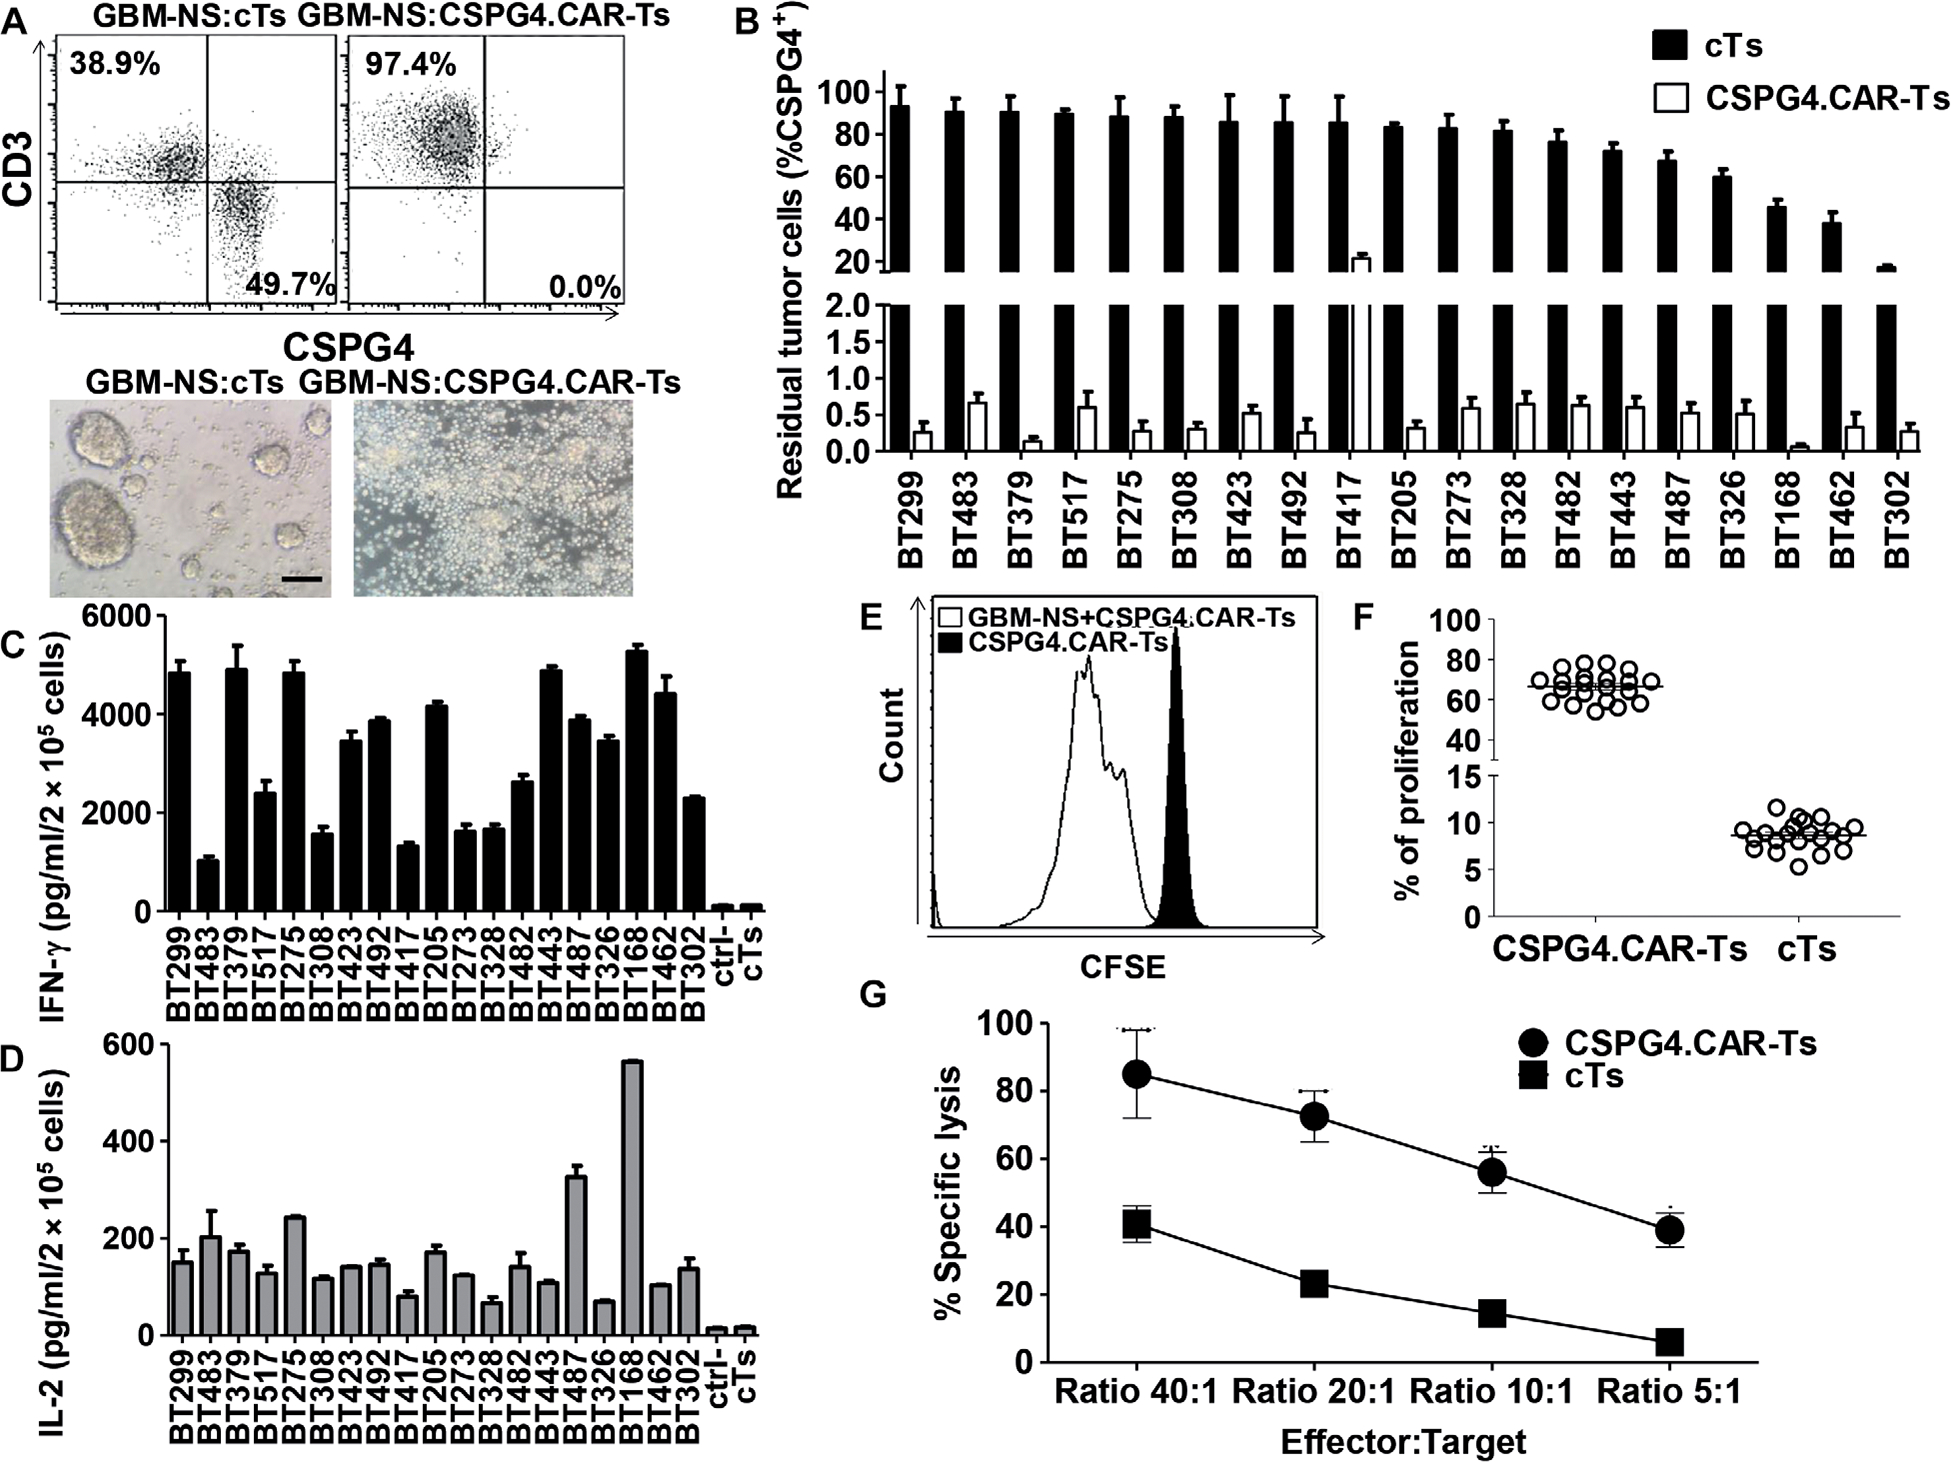
GBM-NS were cocultured in vitro with either cTs or CSPG4.CAR-Ts in GBM-NS serum-free medium [Dulbecco’s modified Eagle’s medium (DMEM)/F12] and B27 supplement. (A) Representative dot plots (upper panel) and microscopic images (lower panel) showing the cytotoxic activity of CSPG4.CAR-Ts compared to cTs. Flow cytometry plots show GBM-NS and T cells on day 3 of coculture as assessed by flow cytometry using CD3 and CSPG4 as markers for T cells and GBM-NS, respectively (scale bar, 200 μm). (B) Bar graph showing the percentage of residual tumor cells in cocultures of CSPG4.CAR-Ts or cTs against 19 GBM-NS at an E:T ratio of 1:5. GBM-NS are ordered by CSPG4 expression (highest to lowest CSPG4-expressing cell lines). Data are means ± SD of T cell preparations obtained from six different healthy donors. (C and D) IFN-γ (C) and IL-2 (D) released by either cTs or CSPG4.CAR-Ts into the supernatant of coculture with GBM-NS within 24 hours. The established cell line T98G was used as a CSPG4-negative target (ctrl). (E) Representative flow cytometry histograms showing the proliferation of CSPG4.CAR-Ts in response to GBM-NS compared to CSPG4.CAR-Ts alone, as evaluated by the CFSE dilution assay on day 7 of coculture in one representative of six donors. (F) Scatter plot showing the proliferation of CSPG4.CAR-Ts in response to 23 GBM-NS compared to cTs. (G) Cytotoxic activity of cTs and CSPG4.CAR-Ts evaluated in a 6-hour 51Cr release assay. Data are means ± SD of T cells generated from two donors against a total of four GBM-NS (BT168-NS, BT308, BT462-NS, and BT275-NS).