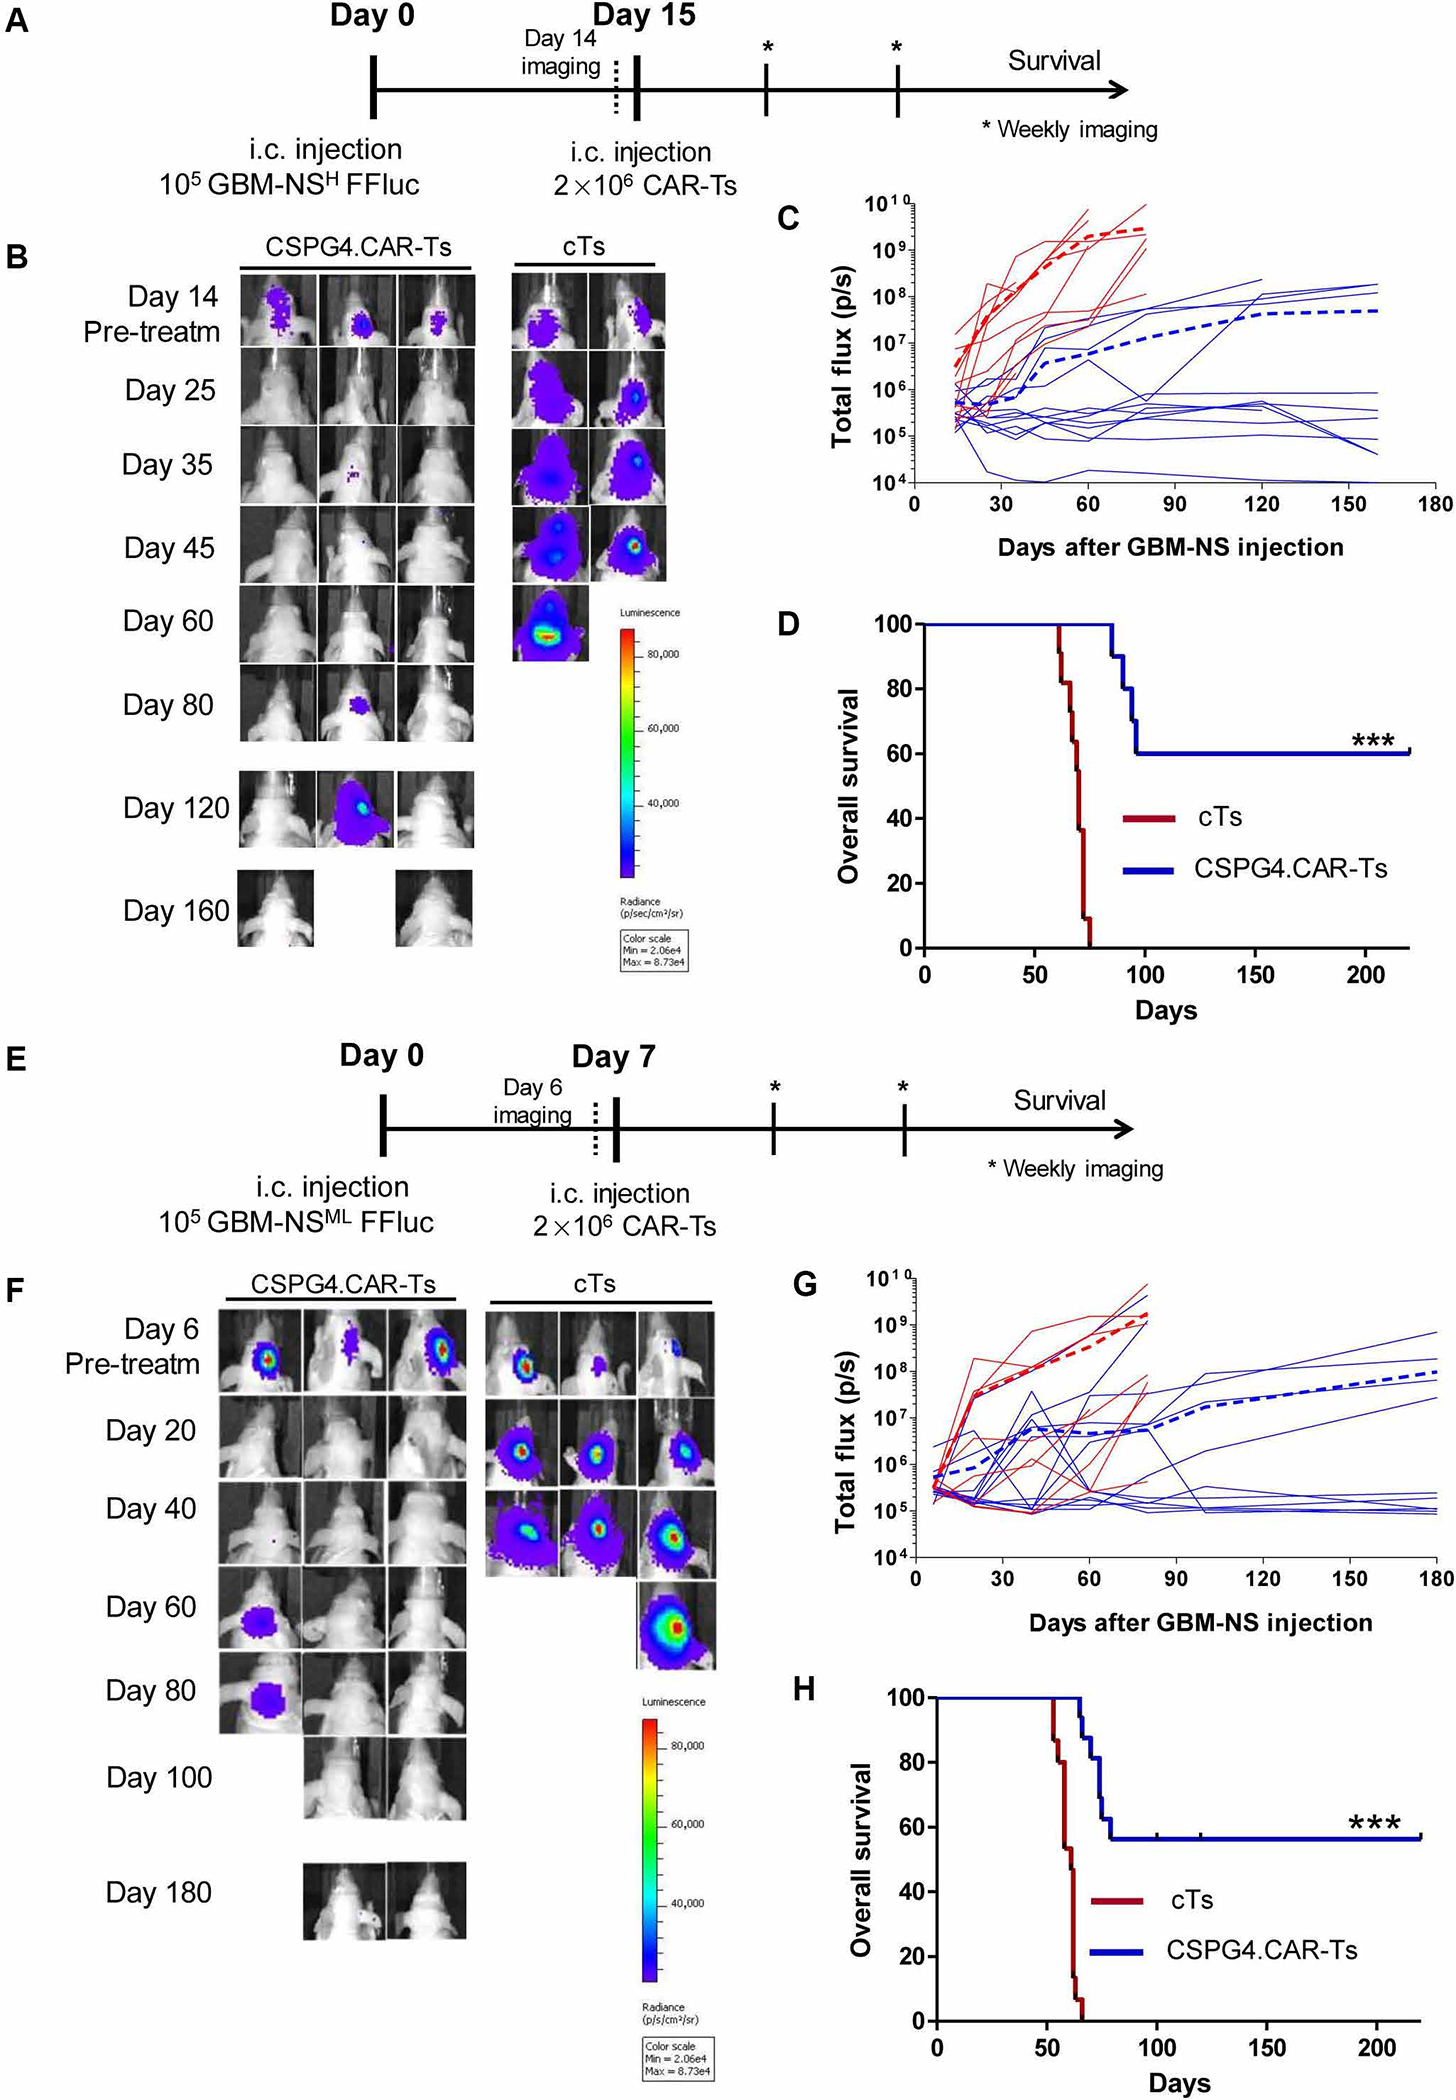
Fig. 3. CSPG4.CAR-Ts control tumor growth in GBM-NS xenograft models.

(A) Nude mice implanted intracranially (i.c.) with GBM-NS CSPG4H (96%, BT308-NS). GBM-NS were labeled with GFP/FFluc. Mice were injected intratumorally with either CSPG4. CAR-Ts or cTs at day 15. (B) Representative in vivo imaging illustrating the growth of GFP/FFluc BT308-NS in treated mice. (C) Line graphs of tumor flux (photons per second) versus time of all BT308-NS–bearing mice treated with cTs (red lines) or CSPG4.CAR-Ts (blue lines). The dotted lines represent the mean photon flux for cTs (dotted red line) and CSPG4.CAR-Ts (dotted blue line). (D) Kaplan-Meier survival curves of BT308-NS–bearing mice injected intratumorally with either CSPG4.CAR-Ts or cTs (***P < 0.0001). (E) Nude mice implanted intracranially with GBM-NS CSPG4ML (49%, BT168-NS). GBM-NS were labeled with GFP/FFluc. Mice were injected intratumorally with either CSPG4. CAR-Ts or cTs at day 7 because BT168-NS showed faster growth in vivo as compared to BT308-NS. (F) Representative in vivo imaging illustrating the growth of GFP/FFluc BT168-NS in treated mice. (G) Line graphs of tumor flux (photons per second) versus time of all BT168-NS–bearing mice treated with cTs (red lines) or CSPG4.CAR-Ts (blue lines). The dotted lines represent the mean photon flux for cTs (dotted red line) and CSPG4.CAR-Ts (dotted blue line). (H) Kaplan-Meier survival curves of BT168-NS–bearing mice injected intratumorally with either CSPG4.CAR-Ts or cTs (***P < 0.0001).
