
Fig. 5. GBM-NS up-regulate CSPG4 in vivo.
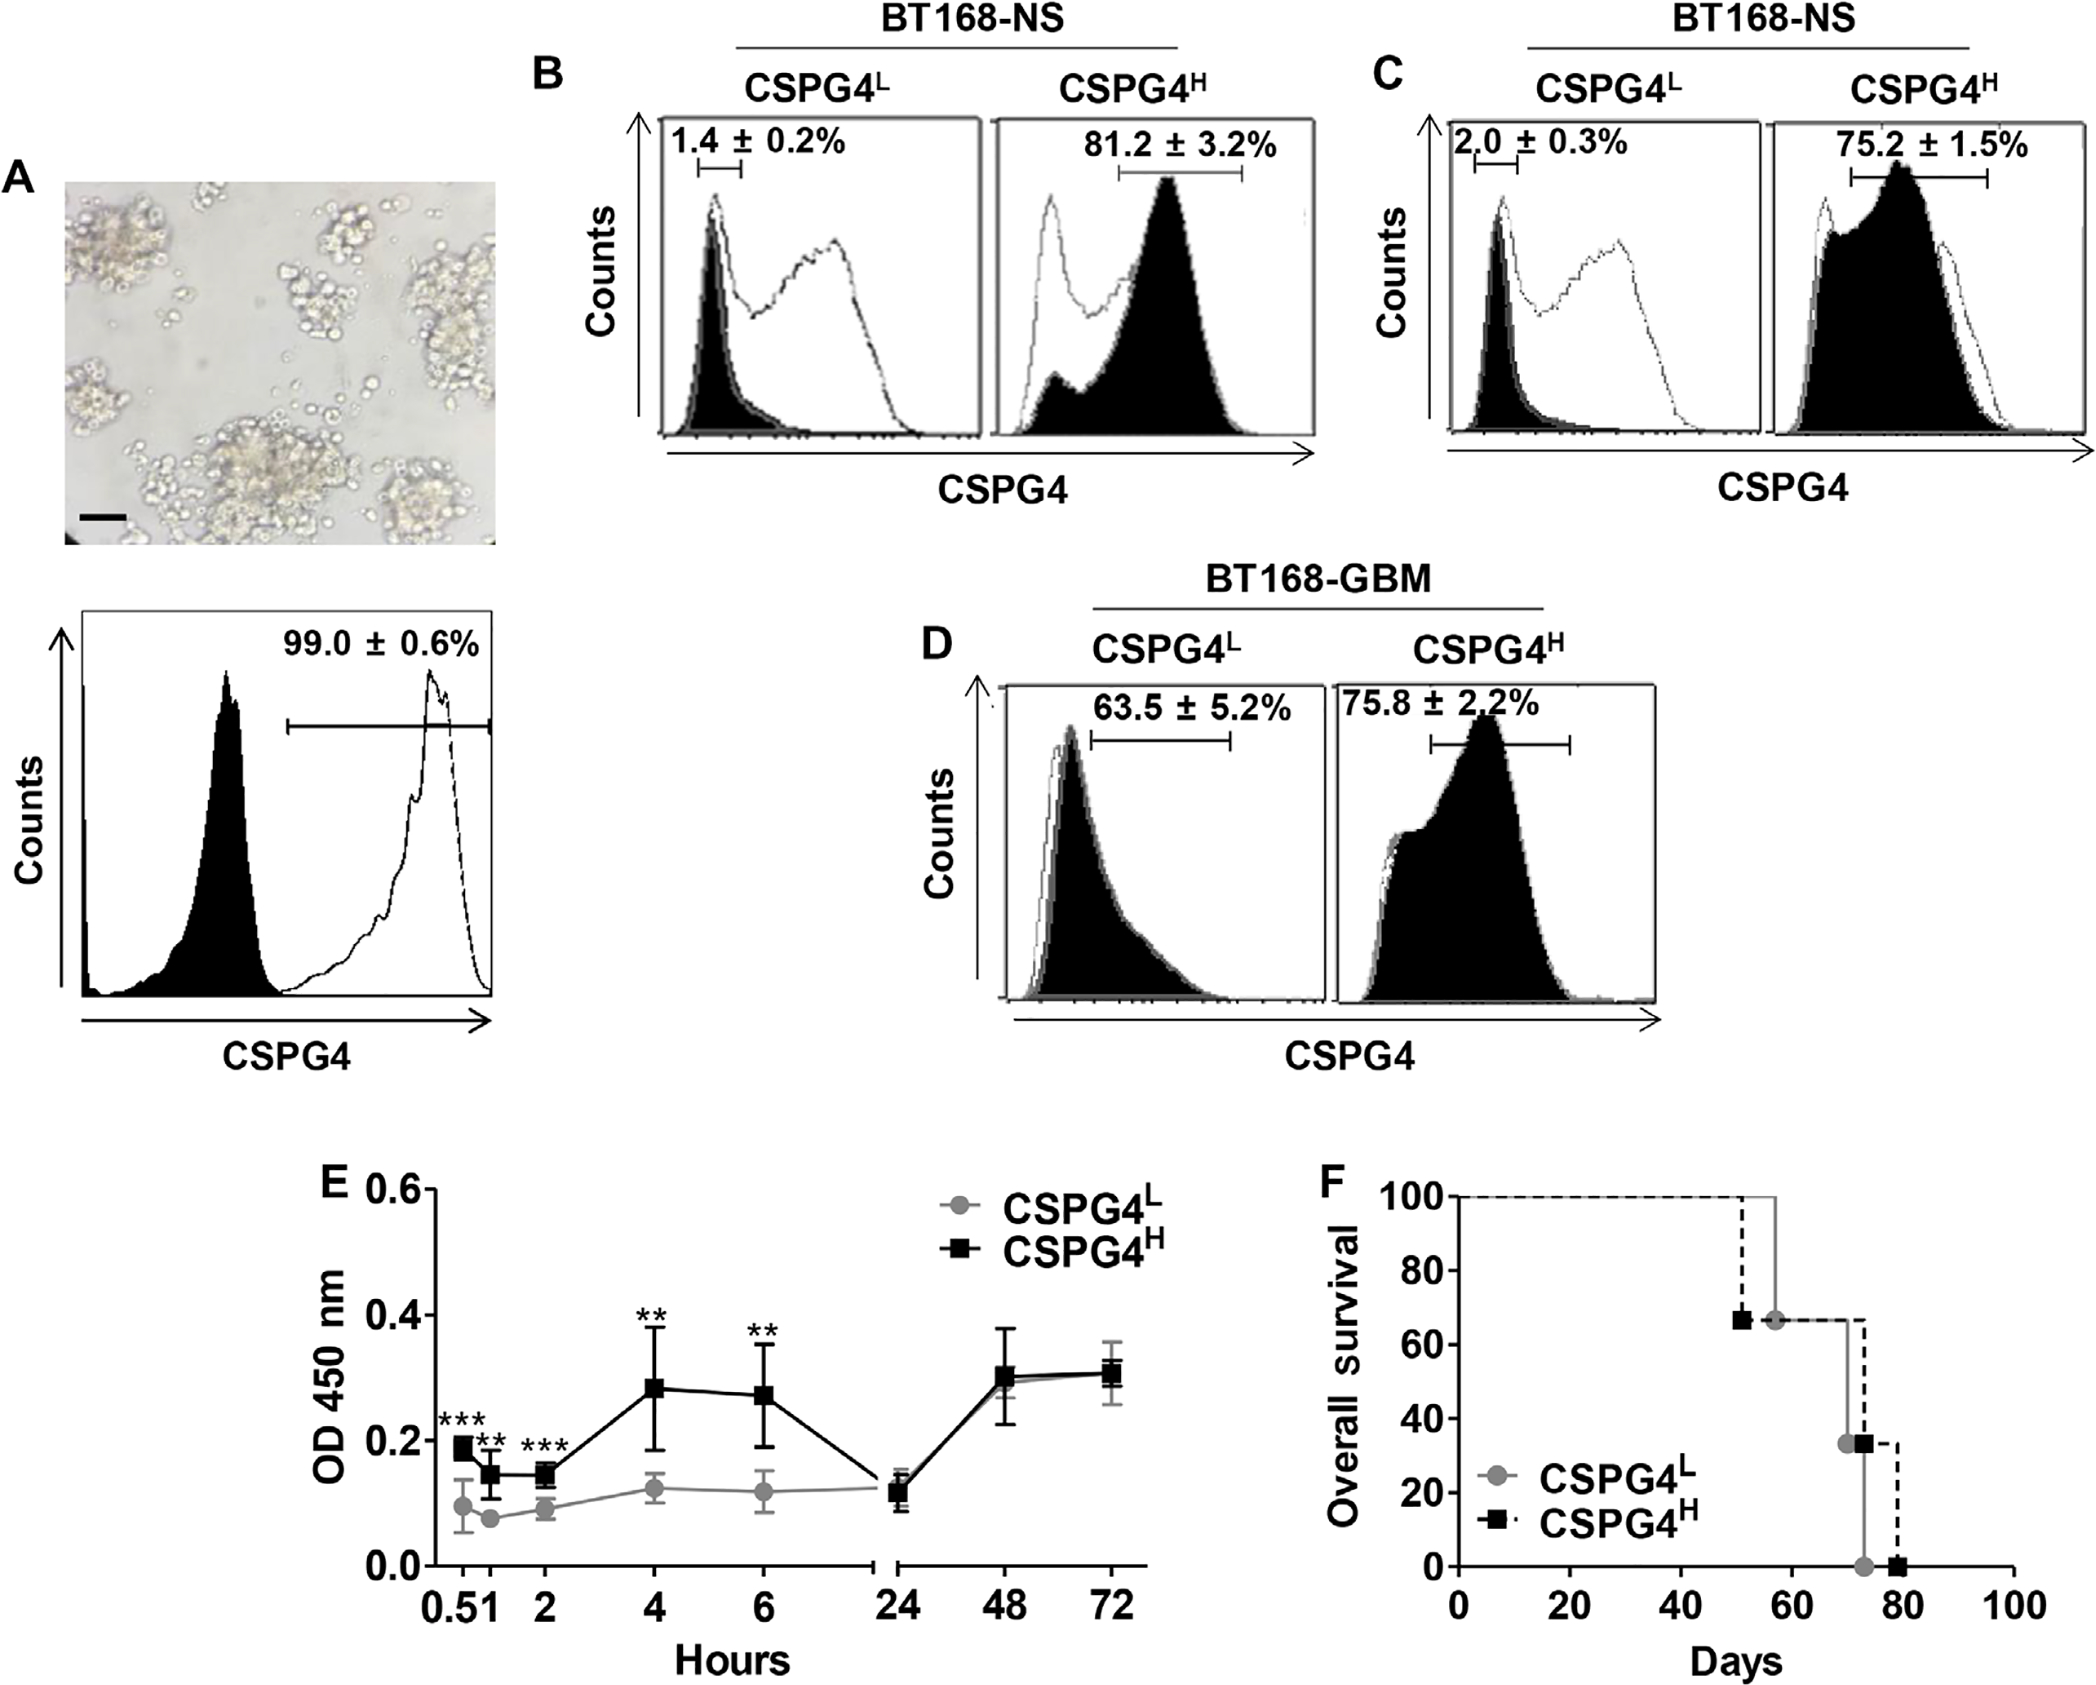
(A) Xenograft gliomas originating from the GBM-NS CSPG4ML (49%, BT168-NS) were explanted from engrafted mice and depleted of contaminant murine cells. Representative in vitro image shows GBM-NS 12 hours after isolation and murine cell depletion (upper panel) (scale bar, 150 μm). CSPG4 expression was assessed by flow cytometry (white histogram) compared to isotype control (black histogram). (B) BT168-NS were selected to obtain CSPG4L and CSPG4H cells using immunomagnetic sorting. Black histograms indicate the expression of CSPG4 in CSPG4L and CSPG4H cells as compared to unselected BT168-NS (white histograms). Data are representative of three different experiments. (C) Expression of CSPG4 (black histograms) in BT168-NS CSPG4L and BT168-NS CSPG4H versus unselected BT168-NS (white histograms) after 3 weeks in culture. (D) Gliomas originating from BT168-NS CSPG4L and CSPG4H cells were removed from engrafted mice. Upon depletion of contaminant murine cells, the expression of CSPG4 was measured by flow cytometry. Black histograms indicate the expression of CSPG4 in BT168 gliomas from CSPG4L and CSPG4H cells, whereas white histograms represent CSPG4 expression in CSPG4L and CSPG4H cells before in vivo implantation. (E) Kinetics of in vitro growth of CSPG4L and CSPG4H as measured by WST assay. (F) Kaplan-Meier survival curves of nude mice implanted intracranially with either BT168-NS CSPG4L or BT168-NS CSPG4H.