
Figure 4: Biological consequences in DDX41 deficient cells.
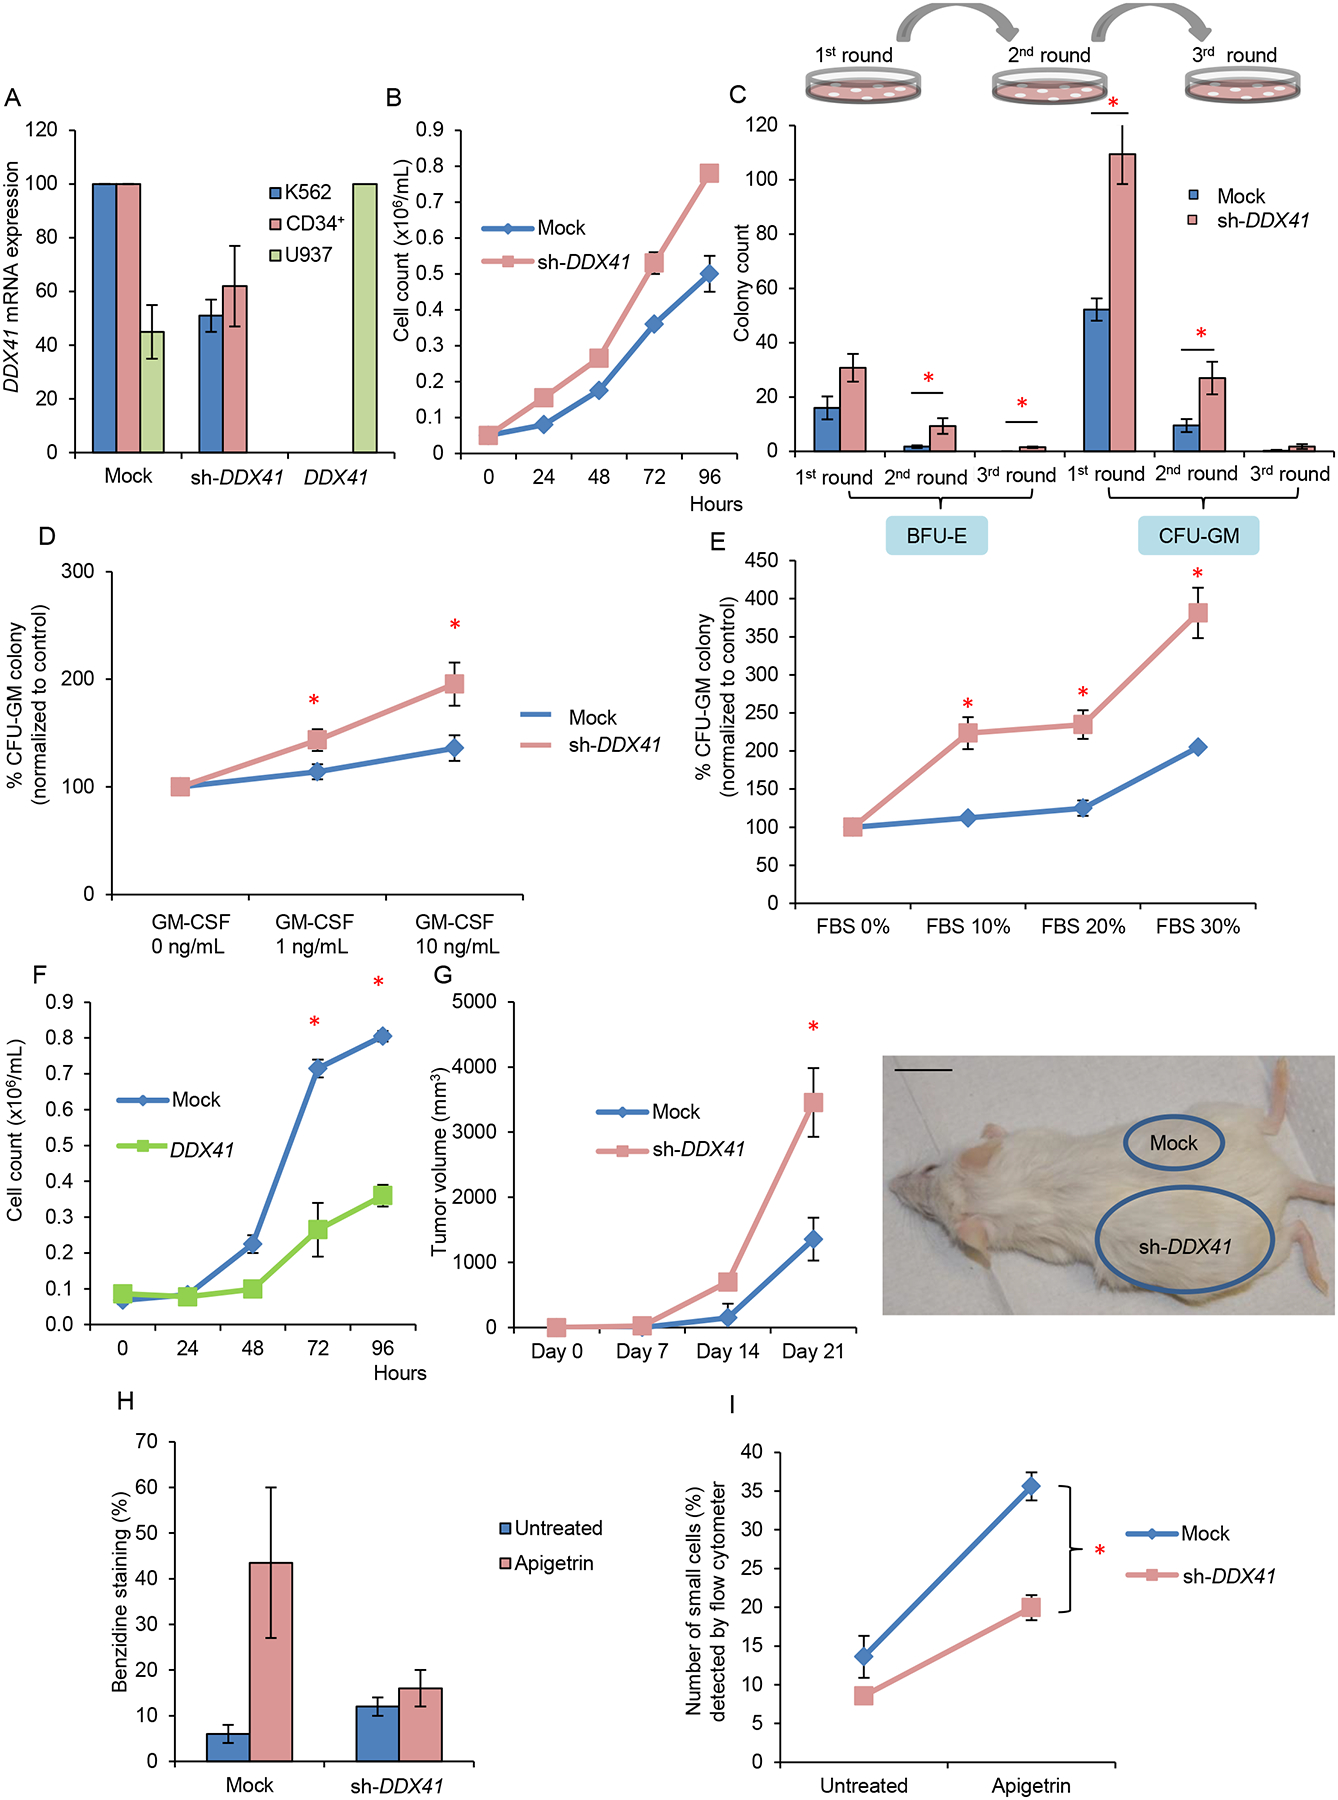
(A) Expression level of DDX41 in leukemic cell lines K562 and U937 and primary CD34+ cells as determined by normalization to GAPDH upon knockdown or overexpression of DDX41.
(B) Growth curves of K562 leukemic cells transduced with DDX41 knockdown construct (sh-DDX41) or mock-transduced. Doubling time of mock vs. sh-DDX41 = 29 hr. vs. 24 hr.
(C) Colony forming assay comparing DDX41 deficient with control primary CD34+ cells. Numbers of plating are indicated. BFU-E burst forming unit-erythroid; CFU-GM colony forming unit-granulocyte/macrophage.
(D) Percentage of CFU-GM colonies derived from plating of DDX41 deficient primary CD34+ cells in the absence or presence of different concentrations of GM-CSF in methylcellulose semisolid medium.
(E) Percentage of CFU-GM colonies derived from plating of DDX41 deficient CD34+ primary cells with various concentrations of FBS.
(F) Growth curves of U937 cells after lentiviral infection with a DDX41 expression construct compared to mock infected control cells. Doubling time of mock vs. DDX41 = 31 hr. vs. 36 hr.
(G) K562 cells with decreased DDX41 expression were injected into the left flank and those with mock transduction were injected into the right flank of NSG mice. n=3 for each experiment. A representative image and quantification of tumor volume are shown. Three series of independent experiments were performed. Scale bar: 1 inch.
(H) Hemoglobin detection of K562 cells with decreased DDX41 expression compared to those with mock transduction before and after exposure to apigetrin. Hemoglobin was measured by benzidine staining.
(I) Percentage of small cell population (mature erythroid cells) as detected by flow cytometry in DDX41 knockdown K562 cells compared with control cells after exposure to apigetrin.
Each bar/value represents the mean±SEM of 3 independent experiments performed in duplicates unless stated otherwise. * p<.05
See also Figure S5