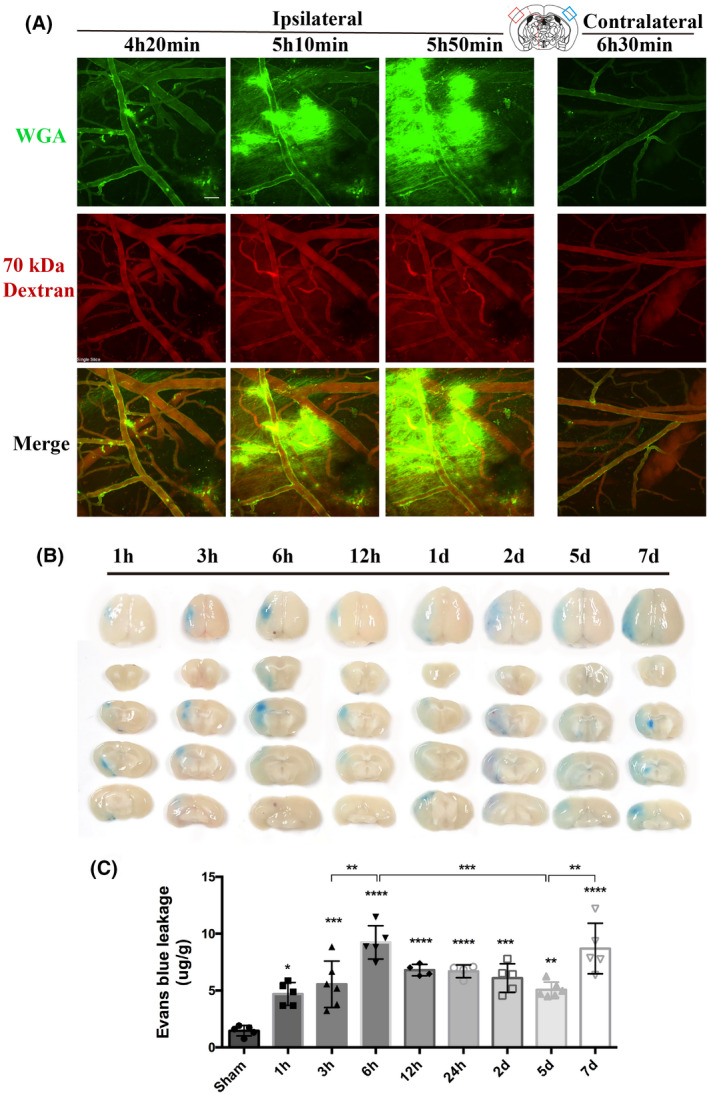
FIGURE 2.

Dynamic evolution pattern of BBB permeability within the first week following cerebral ischemia/reperfusion onset. (A) Representative live two‐photon imaging within the cortical infarct region over time after t‐MCAO. The tracer leakage from blood vessels into the CNS parenchyma was visualized 30min after tail vein injection of lectin wheat germ agglutinin (WGA, green background) and 70 kDa dextran (red background). Scale bar, 50 μm. (B) Representative images showing EB extravasation over time after t‐ MCAO. A column of images represents different brain slices of the same mouse. (C) Quantitative analysis of EB. Differences between operated and sham‐operated controls were significant at the *p < 0.05, **p < 0.01, ***p < 0.001, ****p < 0.0001 levels
