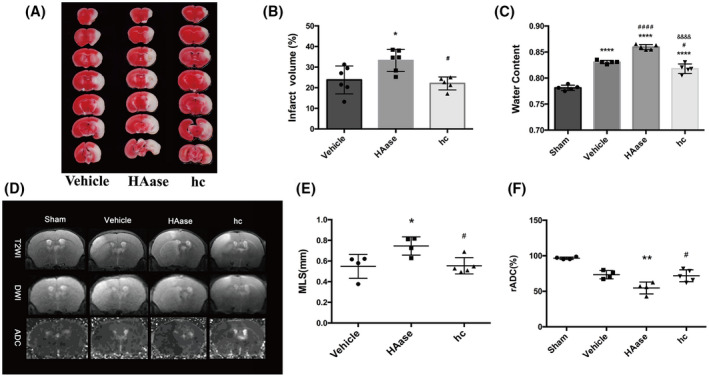
FIGURE 6.

Further degradation of GCX aggravated brain edema after t‐MACO. (A, B) Representative images and quantification of TTC‐ stained brain slices from each group. *p < 0.05 vs. the 6h‐vehicle group; # p < 0.05 vs. the 6h+HAase group. (C) Quantitative analysis of brain parenchymal water content in different groups. ****p < 0.0001 vs. the sham group; # p < 0.05, #### p < 0.0001 vs. the 6h‐vehicle group; &&&& p < 0.0001 vs. the 6h‐HAase group. (D) Representative T2‐weighted images of the tenth slice from each mouse in different groups. ADC images were re‐structured on DWI. Normal signal presented in the left undamaged hemisphere. (E, F) Quantification of edema formation based on MRI images. *p < 0.05, **p < 0.01 vs. the vehicle group; #p < 0.05 vs. the 6h‐HAase group
