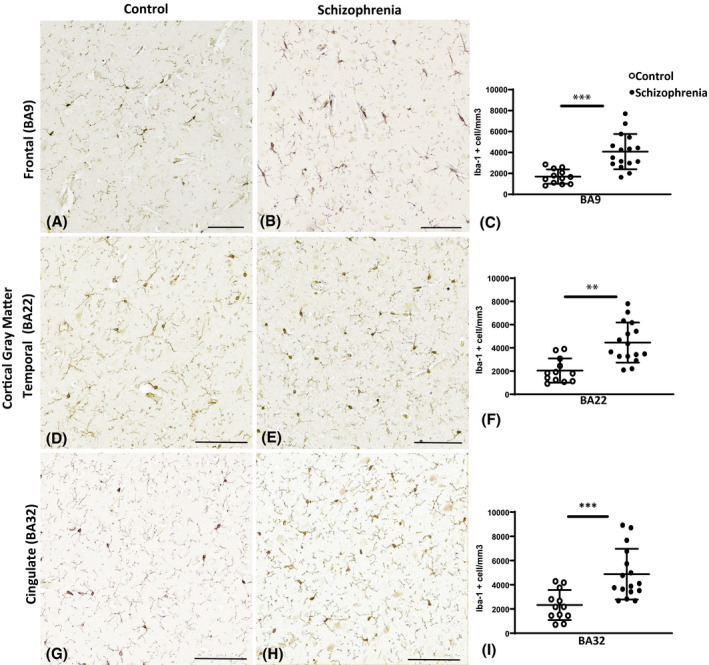
FIGURE 2.

Photomicrographs of the ionized calcium‐binding adaptor molecule 1 (Iba1) immunoreactivity in the control cases (A, D, and G) and in the schizophrenia (SCZ) cases (B, E, and H). Graphs representing the density of microglia per mm3 are seen in (C, F, and I). The asterisks indicate the significant differences in the density of microglia counted in the SCZ cases compared to the control in the dorsal lateral frontal cortex (BA9; C), the superior temporal cortex (BA22; F), and the anterior cingulate cortex (BA32; I). BA, Brodmann area; Scale bar = 20 µm. **p < 0.01, ***p < 0.001
