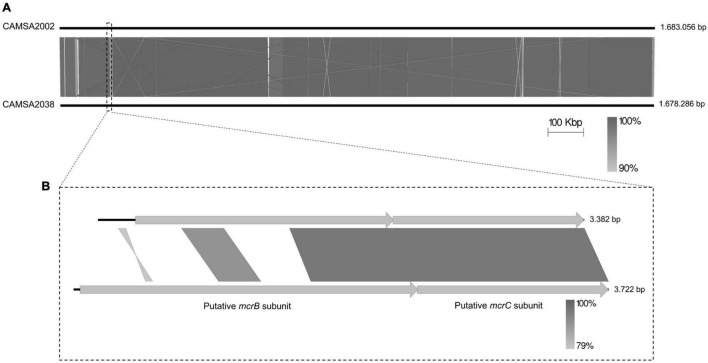
FIGURE 4.
Whole genome comparison of CAMSA2002 and CAMSA2038. (A) The genome sequences are depicted as solid lines and the genome sizes are listed in bp. (B) Alignment of mcrBC genes encoded by CAMSA2002 and CAMSA2038 demonstrating divergence in the N-terminal region responsible for DNA binding. Comparisons are performed using Easyfig (Sullivan et al., 2011).

