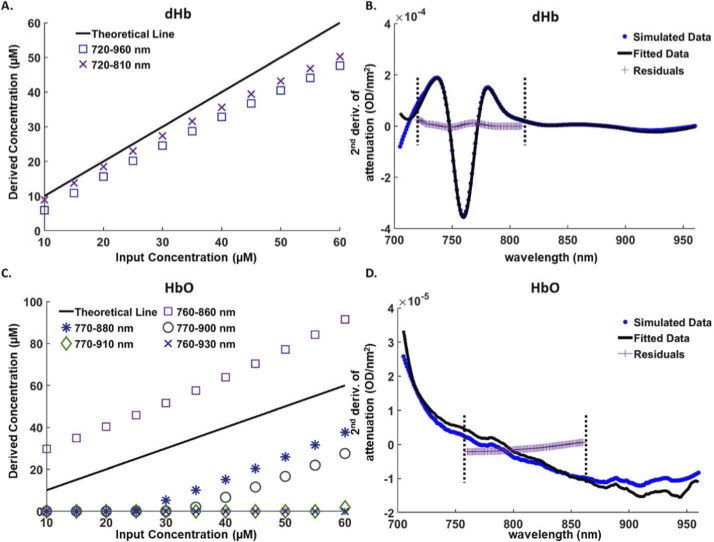
Fig. 5.
The absolute concentration of dHb (μM) (A) and HbO (μM) (C) derived by NIR-AQUA, versus the input concentration of simulated datasets. Different wavelength windows were applied in the fitting process, to find the most accurate wavelength range. The theoretical concentration line (black) where derived = input concentration is shown for comparison. (B) A Second-differential spectrum of a simulated dataset (blue dots) consisting of 20 μM dHb and (D) 40 μM HbO, and their non-negative least-squares model fit with the second derivative of the specific absorption spectra (black line). The fitted data show the strong absorption feature of dHb around 760 nm (B) and the weak features of HbO (D) between 760 nm and 860 nm. Fitting dHb and HbO was found to be optimal over the wavelength range 720 - 810 nm and 760 - 860 nm, respectively. Residuals (purple plus signs) show the accuracy of the fitting model over these wavelength ranges. Dashed vertical lines indicate the wavelength range chosen for the fitting.

