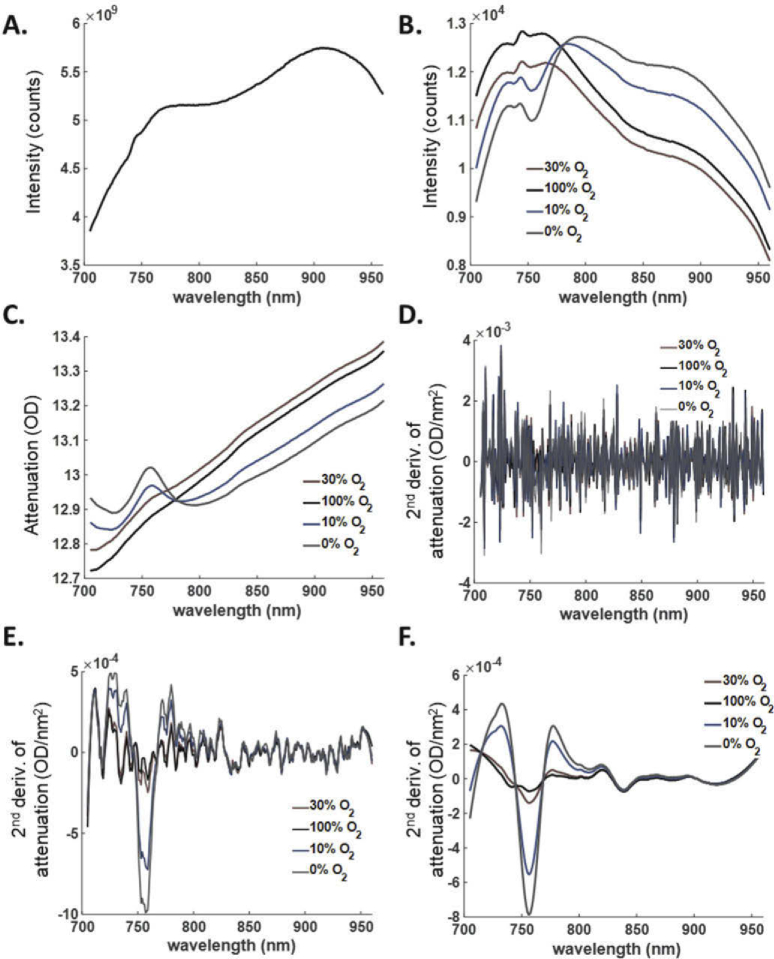
Fig. 7.
Representative NIR spectra collected from the cortex of one mouse. A. Spectra of the light source after calibration (Iref). B. Light intensity (IS) recorded from the cortex of the mouse during different FiO2 levels. Each line represents the average of all the spectra collected during the period of the corresponding O2 challenge. C. Attenuation spectra of the mouse cortex calculated with . D. Second derivative of the attenuation spectra in (C). E. Second derivative of the attenuation spectra in (C) using the smoothing algorithm SAVGOL with the number of smoothing points = 15. F. Second derivative of the attenuation spectra in (C) using the smoothing algorithm SAVGOL with the number of smoothing points = 45.

