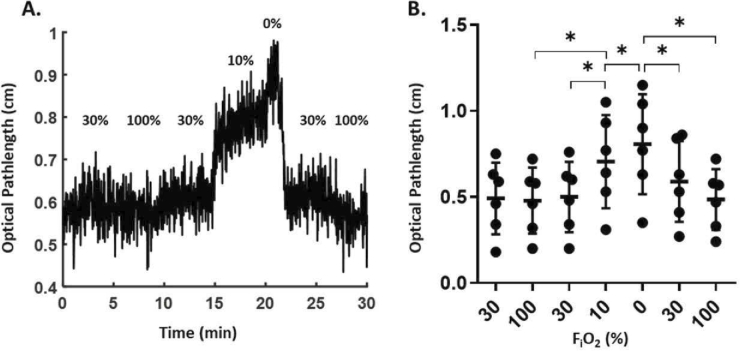
Fig. 8.
A. The mean optical pathlength from a representative mouse calculated by fitting the recorded spectra with H2O absorption spectra over the range 800-850 nm under 4 different FiO2 (100%, 30%, 10%, 0%). B. Measurement of mean optical pathlength under varying FiO2 levels in a group of control mice. Each black dot represents the average value at the corresponding FiO2 level for each mouse (mean ± SD, n = 6). Statistical analysis was performed to compare these values under the different FiO2 using one-way ANOVA with repeated measures and a Bonferroni post-hoc test (*- p ≤ 0.05). Significance between repeated FiO2 levels is not shown for clarity.

