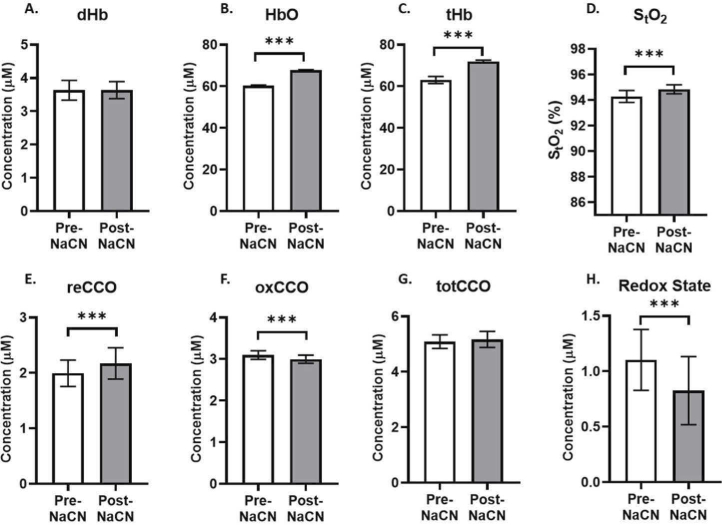
Fig. 12.
In vivo measurement of Hb and CCO pre, and post NaCN infusion. NIR spectra were collected from 2 mice pre and post NaCN (15 mg/kg) infusion at 100% FiO2. Spectral data were collected over 10 minutes under each condition and used to quantify the chromophores from the 2 mice (mean ± SD). t-test was used to compare values pre and post NaCN infusion (*** - p ≤ 0.0001).

