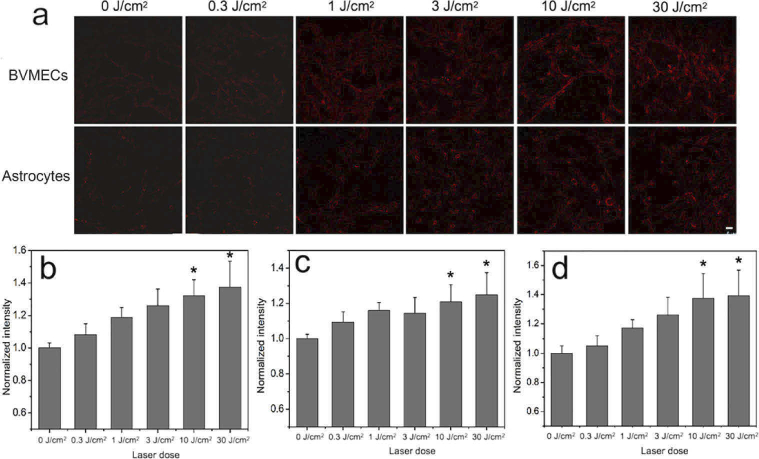
Fig. 6.
Light-induced Ca2+ levels evaluated with Ca2+ fluorescent probe FURA2-AM. (a) Fluorescence microscope images shows Ca2+ levels in BVMECs and astrocytes 10 min after irradiation with various laser doses. Scale bar: 20 µm. Quantification of Ca2+ changes in (b) BVMECs, (c) astrocytes and (d) BBB models 30 min after irradiation.

