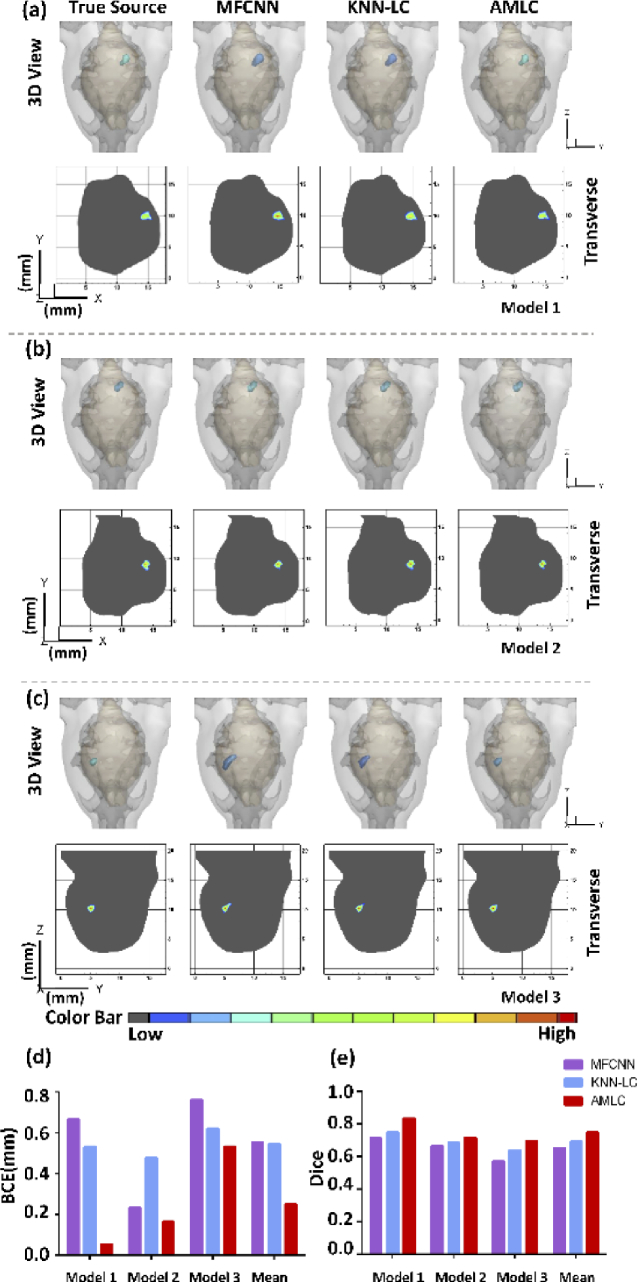
Fig. 2.
CLT reconstruction results of single-source. (a-c) show simulation results in different methods, respectively. 3D views and 2D cross sections visually display the reconstruction results. (d) represents BCE of the reconstructed sources, while (e) represents Dice of the reconstructed sources. The mean BCE and Dice of three models are shown in (d) and (e), respectively.

