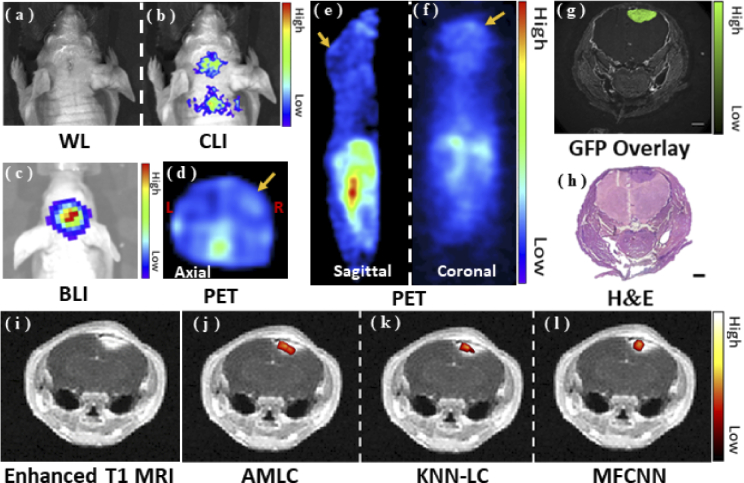
Fig. 6.
In vivo experimental results. (a-c) show the white light (WL) image, CLI and BLI results, respectively. (d-f) show the in vivo PET results. The yellow arrows show the tumor area. (g-h) represent GFP fluorescence image and the H&E stain result. (i-l) show the reconstruction results merged with MRI to evaluate reconstruction performance.

