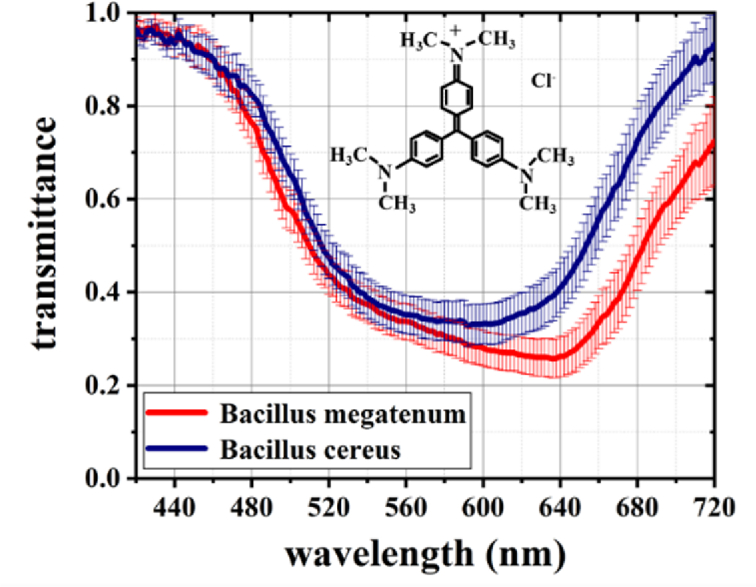
Fig. 4.

Average spectra of B. megaterium and B. cereus. The error bars on the spectra represent the transmittance difference between the different target points at the same wavelength. The inset is a schematic illustrating the chemical structure of CV.
