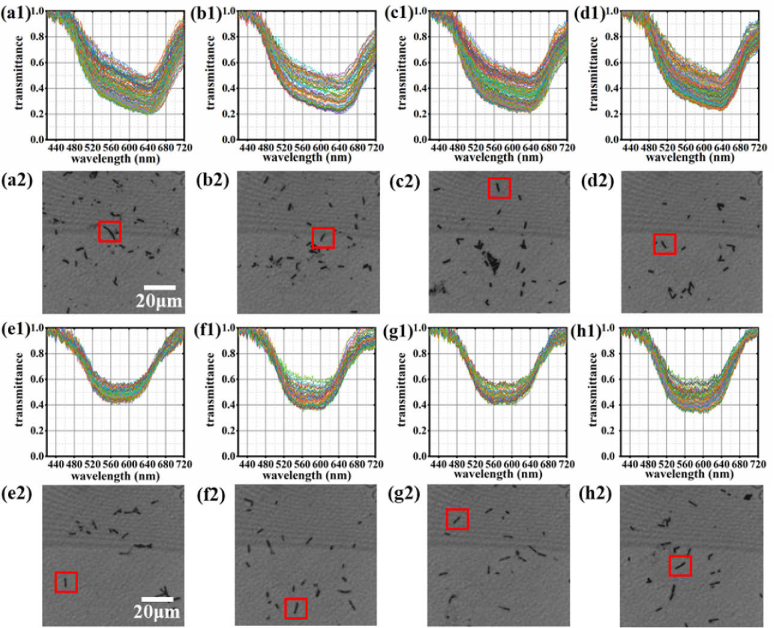
Fig. 5.
Spectral information of several bacteria. (a1) shows the spectra of all pixels in a B. megaterium corresponding to the bacterium in the red box in (a2). (b1)–(d1) are also the spectra of the other three samples of B. megaterium corresponding to the bacteria in the red box in (b2), (c2) and (d2) respectively. (e1) shows the spectra of all pixels in a B. cereus corresponding to the bacterium in the red box in (e2). (f1)–(h1) are also the spectra of the other three B. cereus corresponding to the bacteria in the red box in (f2), (g2) and (h2) respectively.

