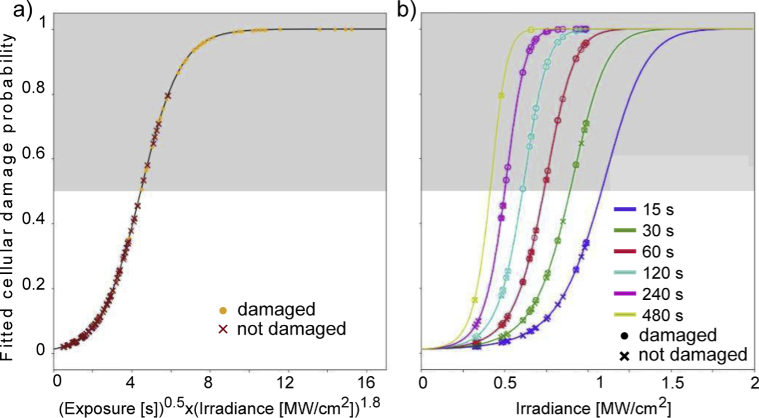
Fig. 3.
a) Graphical representation of the damage probability curve depending on the applied irradiance and exposure times in sample points irradiated by a fixed laser. b) Graphical representation of the damage probability curves depending on the applied irradiance in sample points irradiated by a fixed laser for different exposure times.

