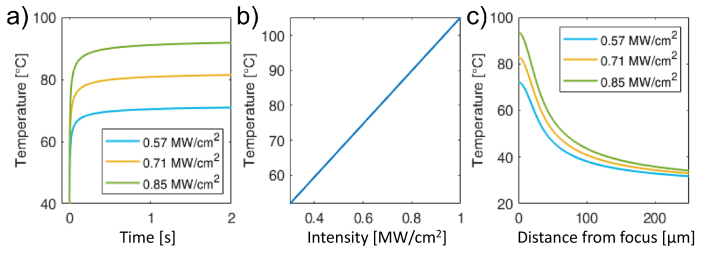
Fig. 5.
a) Temperature increase on the sample over time at the coordinate of the laser focal spot ( ), calculated with Eq. (6), for 3 different irradiances. b) Peak temperature reached on the sample calculated using Eq. (6), as a function of irradiance. c) Evolution of the temperature profile in the Petri dish for three different irradiances.

