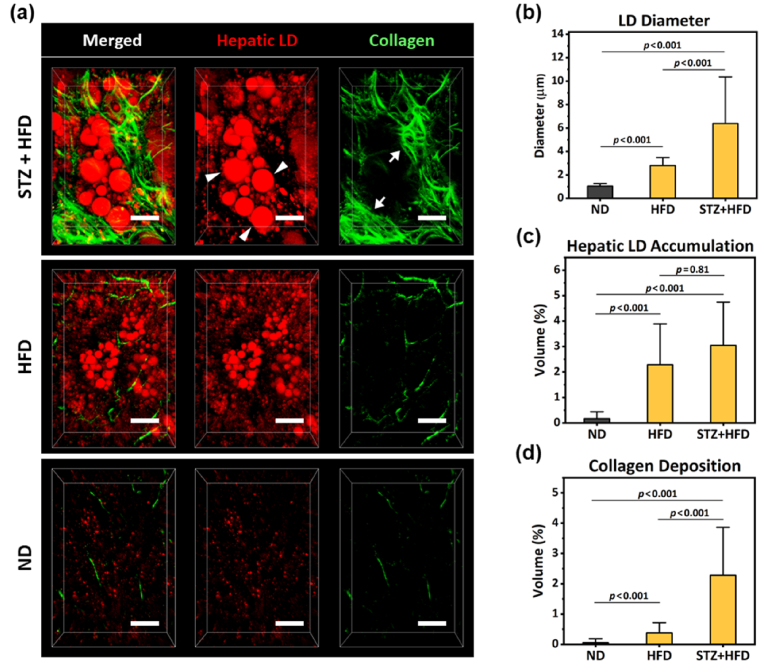
Fig. 2.
Subcellular-level intravital two-photon imaging and quantification of hepatic LDs and collagen fiber. (a) Representative magnified 3-dimensionally reconstructed images showing subcellular level features, accumulation of hepatic LDs (red, arrowhead) and perisinusoidal collagen (green, arrow), in the liver of STZ-treated high-fat diet fed mouse (STZ + HFD), only high-fat diet fed mouse (HFD) and normal diet fed mouse (ND). Scale bars, 20 µm. (b-d) Average LD diameter, 3D volumetric proportion occupied by hepatic LD and collagen in the total imaging volume (n=3). Data are presented as mean ± SD of mean. Statistical significance was set at p-value less than 0.05.

