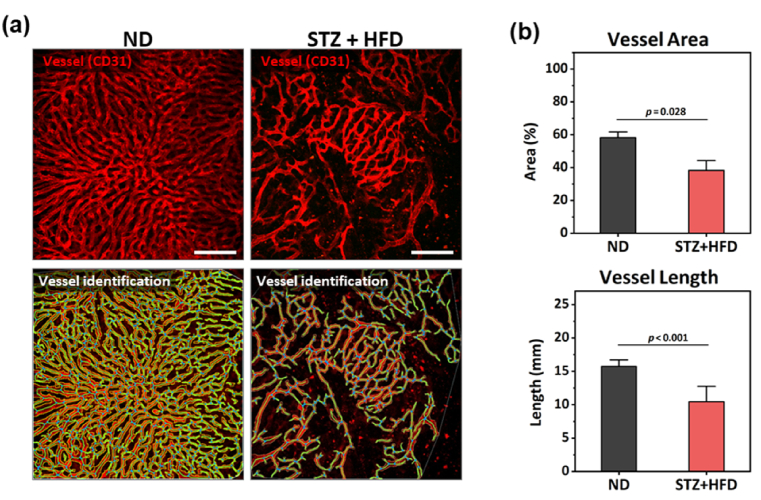
Fig. 4.
Structural distortion of sinusoidal microvasculature in the liver of diabetic NAFLD mouse model. (a) Representative images of sinusoidal vessels (red) and automatic identification of vessels in the liver STZ-treated high-fat diet fed mouse (STZ + HFD) and normal diet fed mouse (ND) (n=3). Scale bars, 100 µm. (b) Quantification of vessel area and length. Data are presented as mean ± SE of mean. Statistical significance was set at p-value less than 0.05.

