Figure 1.
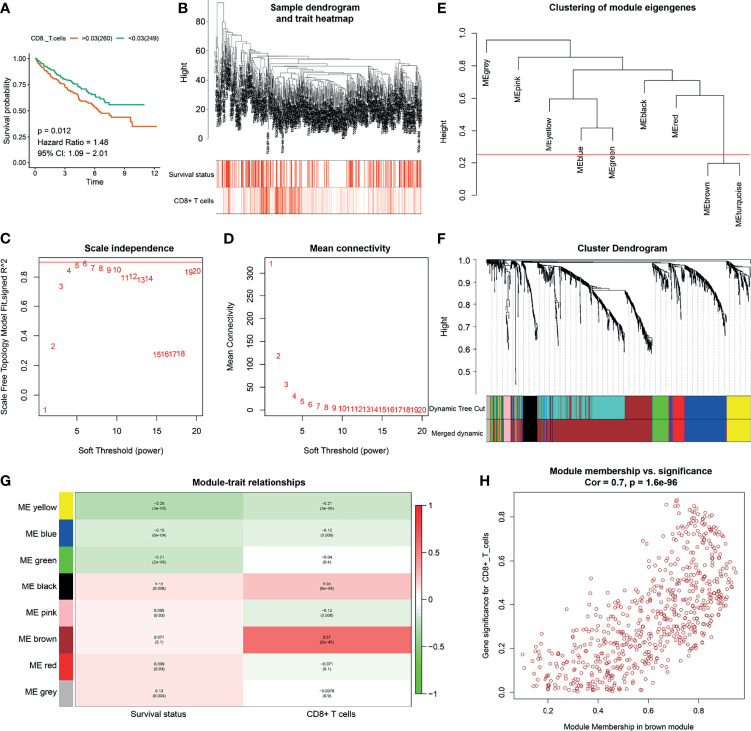
Identification of CD8+ T cell related genes. (A) Kaplan-Meier analysis of CD8+ T cells. (B) Clustering dendrograms of immune-related differentially expressed genes (IRDEGs). Color intensity varies positively with abundance of CD8+ T cells. In terms of survival status, red means dead and white indicates live. (C, D) Analysis of scale-free fit index (C) and mean connectivity (D) for various soft-thresholding powers. (E) Clustering of module eigengenes. The red line shows cut height (0.25). (F) Dendrogram of robust IRDEGs clustered based on a dissimilarity measure (1-TOM). (G) Heatmap of the correlation between module eigengenes and clinical traits of ccRCC. Each cell contains p-value and the correlation coefficient. (H) Scatter plot of module eigengenes related to abundance of CD8+ T cells in the brown module.

