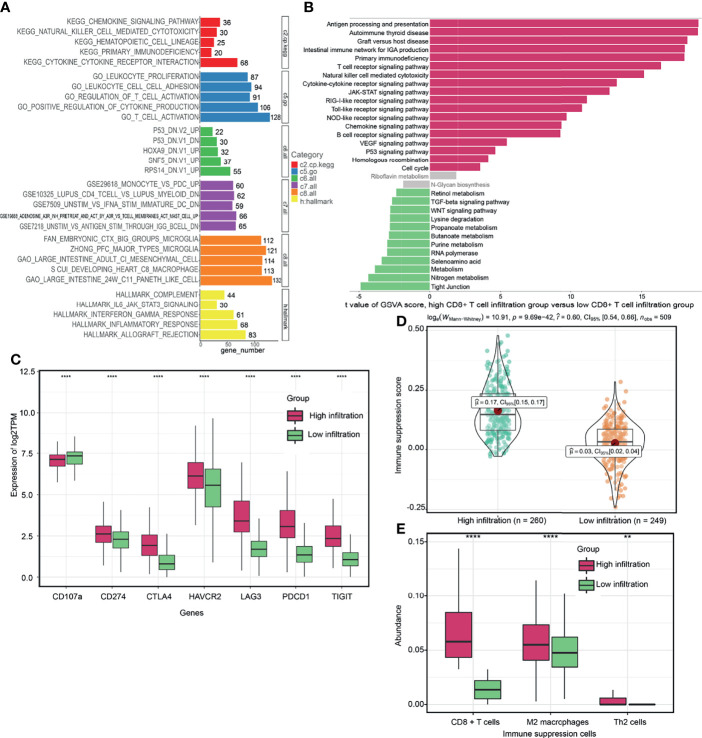
Figure 2.
Potential biological functions of CD8+ T cells. (A) Comprehensive functional enrichment analysis of CD8+ T cell related genes. (B) Gene set variation analysis (GSVA) between high CD8+ T cell- infiltration and low CD8+ T cell- infiltration groups. (C, D) Differences of immune-related signatures between high CD8+ T cell- infiltration and low CD8+ T cell- infiltration groups. (E) The abundance of each immunosuppressive cell in high CD8+ T cell- infiltration and low CD8+ T cell- infiltration groups. (****P < 0.0001; **P < 0.01).

