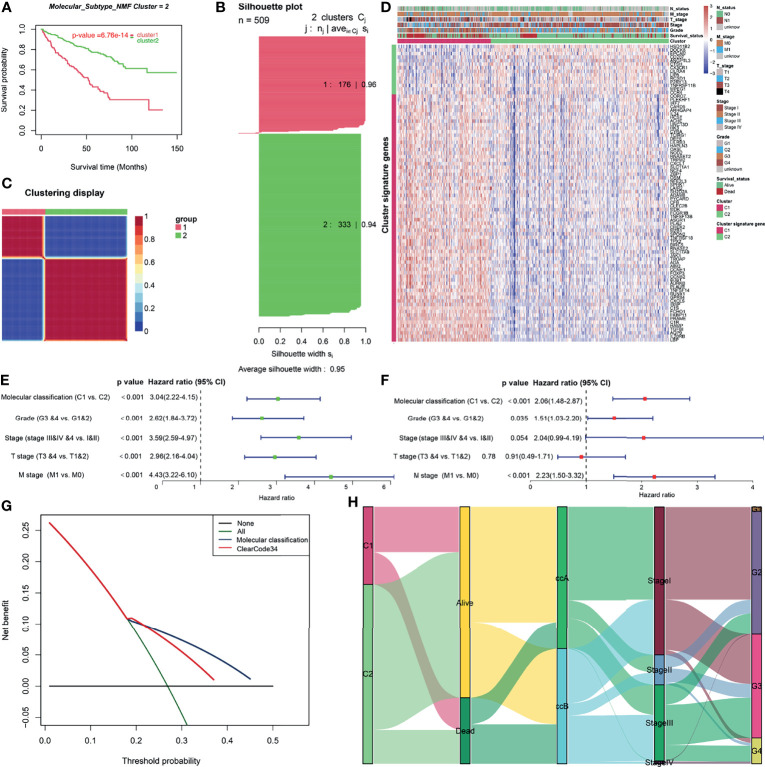
Figure 3.
Construction and clinical significance analysis of molecular classification in TCGA cohort. (A) Kaplan-Meier analysis showed the Cluster1 patients had significantly poorer prognosis than Cluster2 patients. (B) Silhouette coefficients near 1 indicate that the sample is distinguished from neighboring clusters and determine that the best number of clusters was two. (C) Differential expression tested the expression difference between two clusters. (D) Heatmap of the specific cluster-associated genes. Forrest plot of univariate (E) and multivariate (F) Cox regression analysis in the TCGA cohort. (G) DCA for 5-year OS prediction shows that the molecular cluster (Cluster) has higher net benefit across 0% to 50% threshold probabilities than ClearCode34 classification (Classification). (H) A Sankey plot was used to reveal the correlation between molecular cluster, ClearCode34 classification, and clinical characteristics. (DCA, decision curve analysis; TCGA, The Cancer Genome Atlas; OS, overall survival).

