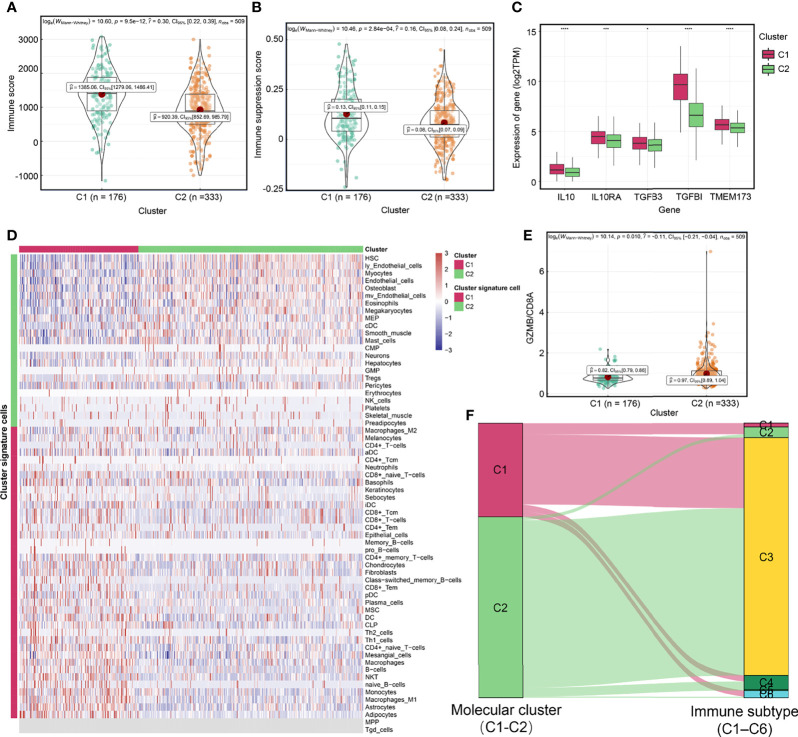
Figure 4.
Exploration of extrinsic immune escape mechanisms among molecular clusters. Differences of immune score (A) and immune suppression score (B) between two molecular clusters. (C) Differences of the expression of TMEM173 (STING), IL10, IL10RA, TGFB3 and TGFBI between molecular clusters. (D) The relationship between molecular clusters and immune and non-immune cells in the tumor microenvironment. (E) The GZMB/CD8A ratio among molecular clusters. (F) A Sankey plot was used to reveal the correlation between molecular cluster and immune subtype. (****P < 0.0001; ***P < 0.001; *P < 0.05).

