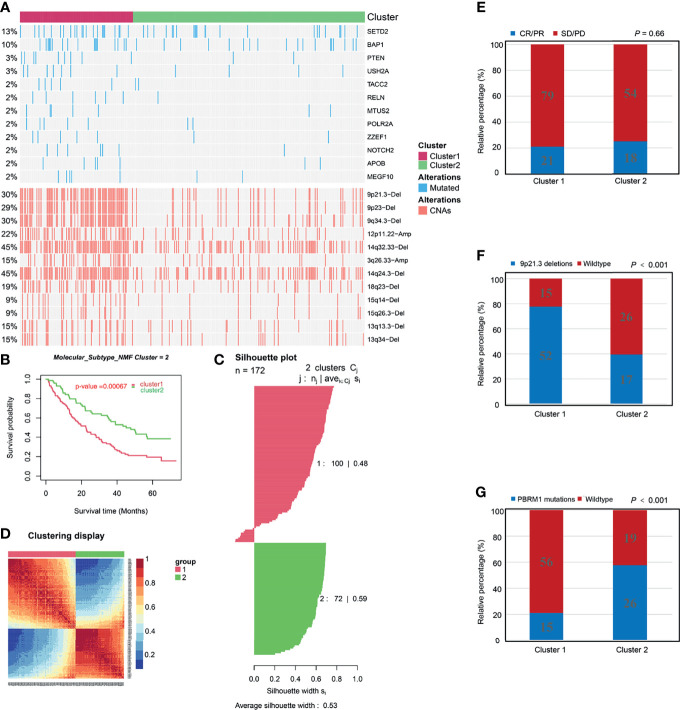
Figure 6.
Associations between molecular clusters and immune checkpoint blockade therapy. (A) Distribution of driver genes mutation, copy number alterations (CNAs) among the two molecular clusters. (B-D) Identification and validation of molecular clusters according to the CD8+ T cell-related genes in the Check-mate 025 cohort. (B) Kaplan-Meier analysis showed the Cluster1 patients had significantly poorer prognosis than Cluster2 patients. (C) Silhouette coefficients indicate that the sample is distinguished from neighboring clusters. (D) Differential expression tested the expression difference between two clusters. (E) The proportion of patients with response to Nivolumab immunotherapy in C1 and C2 cluster. CR, complete response; PR, partial response; SD, stable disease; PD, progressive disease. (F) The proportion of patients with Deletions of 9p21.3 in C1 and C2 cluster. (G) The proportion of patients with PBRM1 mutations in C1 and C2 cluster.

