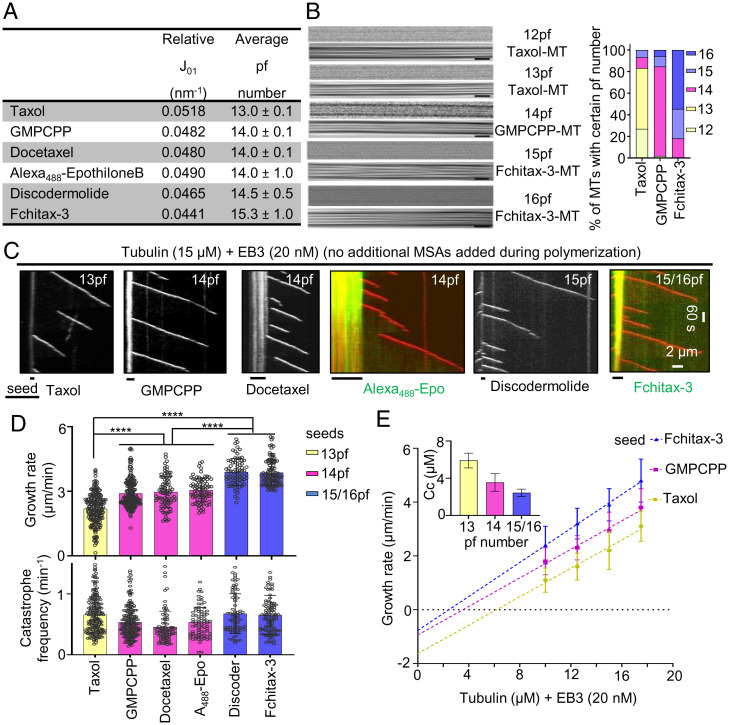
Fig. 1.
Microtubule protofilament number affects microtubule growth rate. (A) X-ray fiber diffraction measurements for protofilament numbers of microtubules polymerized in the presence of different MSAs. For each condition, a total of 24 diffraction images were averaged and background-subtracted using ImageJ software. (B) Representative raw cryo-EM images and their filtered versions emphasizing their Moiré patterns. (Scale bars, 25 nm.) The bar graph shows microtubule (MT) protofilament number distribution determined by Moiré pattern visualization for each microtubule. Microtubule population: n = 89 for Taxol; n = 52 for GMPCPP; and n = 77 for Fchitax-3. (C) Representative kymographs showing microtubule dynamics in the presence of seeds stabilized with the indicated compounds, supplemented with tubulin (15 μM) and mCherry-EB3 (20 nM) in the absence of any additional MSAs during the reaction. (D) Quantification of growth rates (Upper) and catastrophe frequencies (Lower) in the presence of seeds with different protofilament numbers. From left to right, n = 193, 196, 82, 81, 76, and 104 growth events; n = 2 independent experiments for docetaxel, Alexa488-epothilone B, and discodermolide; n = 3 independent experiments for Taxol, GMPCPP, and Fchitax-3. Error bars represent SD; ****P < 0.0001, Mann–Whitney U test. (E) Microtubule growth rate as a function of tubulin concentration (10 to 17.5 μM) from seeds with different protofilament numbers. Error bars represent SD; critical concentration Cc (mean ± SEM), calculated based on the linear fits of the data, is shown (Inset); n = 3 independent experiments. Microtubule growth events: n = 280, 161, and 221 for 10 μM; n = 369, 254, and 193 for 12.5 μM; n = 193, 196, and 104 for 15 μM; and n = 243, 208, and 214 for 17.5 μM for Taxol, GMPCPP, and Fchitax-3, respectively.

