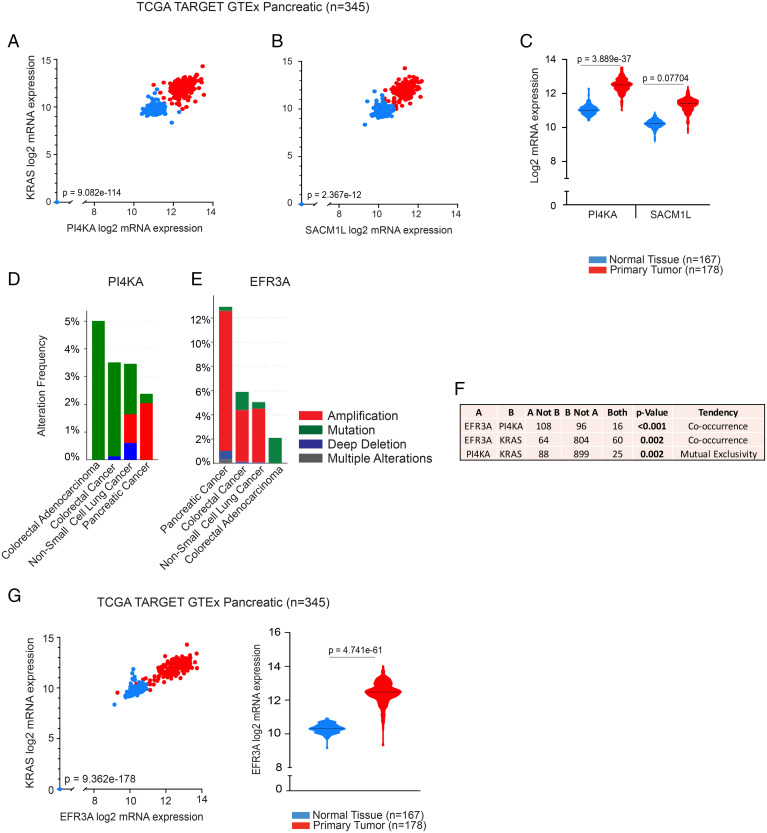
Fig. 4.
Analysis of PI4KA, SACM1L, and EFR3A expression levels in PDAC. Scatter plots indicating positive correlation of mRNA expression levels of KRAS with PI4KA (Pearson’s rho = 0.8817) (A) and SACM1L (Pearson’s rho = 0.3657) (B), in normal and primary tumor human pancreatic tissue samples (TCGA TARGET GTEx, n = 345). Violin plots indicating medians of PI4KA and SAC1ML (C) mRNA expression levels in the same cohort. Bar graphs showing the extent and nature of genetic alterations occurring in PI4KA (D) and EFR3A (E) in pancreatic, lung, and CRC cohorts and how their genetic states relate to one another (F). Bar graphs and statistical analyses were generated in cBioPortal (n = 3176). (G) Scatter plot indicating positive correlation of mRNA expression levels of KRAS with EFR3A (Pearson's rho = 0.9518), and a violin plot indicating median mRNA expression level of EFR3A in the same cohort as in A. Statistical significance was analyzed with Welch’s t test for violin plots generated using the University of California Santa Cruz (UCSC) Xena Browser.

