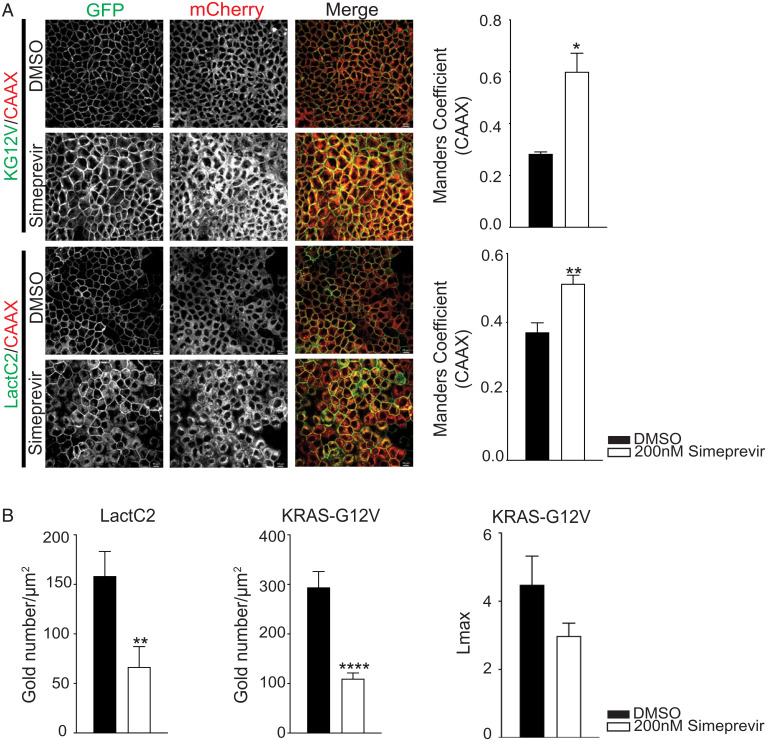
Fig. 5.
Simeprevir mislocalizes KRAS and PtdSer from PM in the nanomolar range. (A) MDCK cells expressing GFP-KG12V and mCherry-CAAX or GFP-LactC2 and mCherry-CAAX were treated with DMSO or simeprevir for 72 h at varying concentrations then imaged with confocal microscopy. Representative images are shown. The extent of KRAS and LactC2 mislocalization was quantified using Manders coefficient (±SEM, n ≥ 5). (Scale bar, 20 μm.) (B) Basal PM sheets from cells in A treated with 200 nM simeprevir for 48 h were prepared and labeled with 4.5 nm gold-conjugated anti-GFP antibodies and visualized by EM. The amount of PM KRASG12V and LactC2 was measured as gold particle labeling per micrometer2. Significant differences were quantified using Student’s t tests. KRAS clustering was quantified by univariate spatial analysis, summarized as Lmax values, and significant differences were assessed using bootstrap tests (±SEM, n ≥ 17) (*P < 0.05, **P < 0.01, and ****P < 0.001). KG12V, KRASG12V; LactC2, PtdSer probe.

