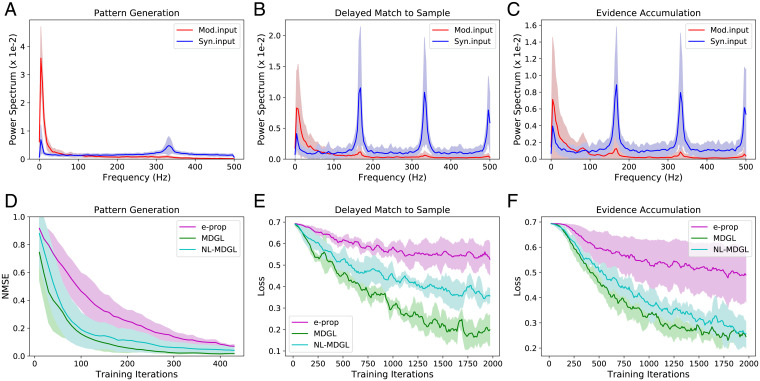
Fig. 4.
Spatiotemporal characteristics of local neuromodulation. (A–C) Power spectra of modulatory (Mod.input; total cell-type–specific modulatory signal detected by each cell—Eq. 21) and synaptic inputs (Syn.input; total input received through synaptic connections by each cell—Eq. 22) are compared after learning for all tasks. Solid lines denote the average, and shaded regions show the SD of power spectrum across recurrent cells. Raw input traces are included in SI Appendix, Fig. S10. (D–F) Performance degrades when neighborhood specificity of modulatory signaling (NL-MDGL) is removed so that cell-type–specific modulatory signals diffuse to all cells in the network without attenuation. Learning with spatially nonspecific modulation still outperforms that without modulatory signaling (e-prop).

