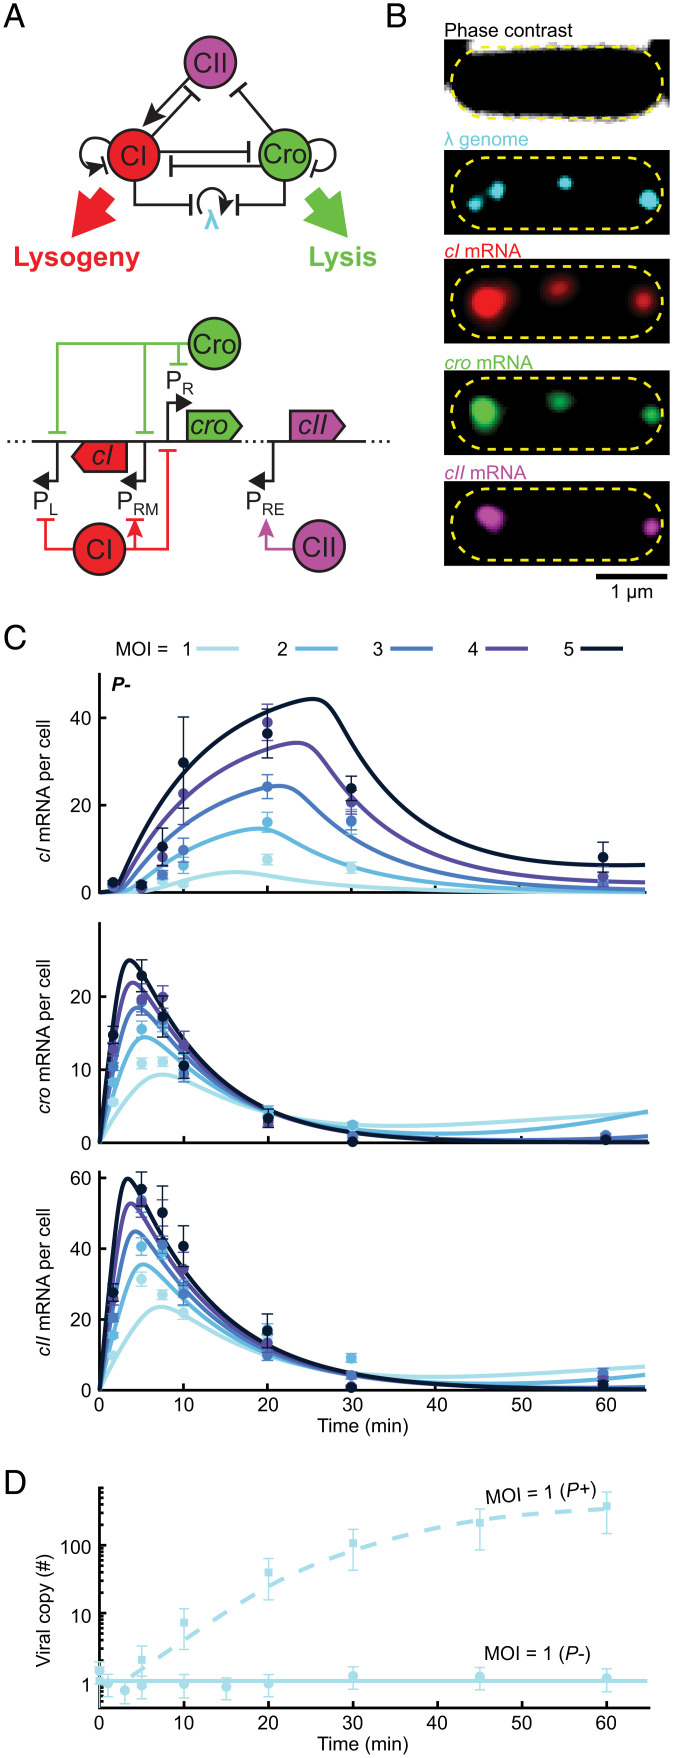
Fig. 2.
A simplified model of the decision network captures the kinetics of mRNA and viral copy number following infection. (A, Top) The three-gene circuit at the heart of the lysis/lysogeny decision. (Bottom) The corresponding segment of the lambda genome. Upon viral entry, PR expresses both cro and (following a leaky terminator) cII. CII then activates cI expression from PRE. CI and Cro repress PR and PL as well as phage replication. In a lysogen, CI regulates its own expression from PRM. (B) Images of a single E. coli cell at 10 min following infection by λ cI857 Pam80 P1parS. Phage genomes are labeled using ParB-parS and the mRNA for cI, cro, and cII using single-molecule fluorescence in situ hybridization. The yellow dashed line indicates the cell boundary. (C) The numbers of cI, cro, and cII mRNA per cell at different times following infection by P− phage (λ cI857 Pam80 P1parS) at MOI = 1 to 5. Markers and error bars indicate experimental mean ± SEM per sample (refer to SI Appendix, Table S6 for detailed sample sizes). Solid lines indicate model fit. (D) Viral copy number measured using qPCR following infection at MOI = 1 by P+ and P− phages. Markers and error bars indicate experimental mean ± SD because of qPCR calibration uncertainty. Lines indicate model fits. Refer to SI Appendix for detailed information.

