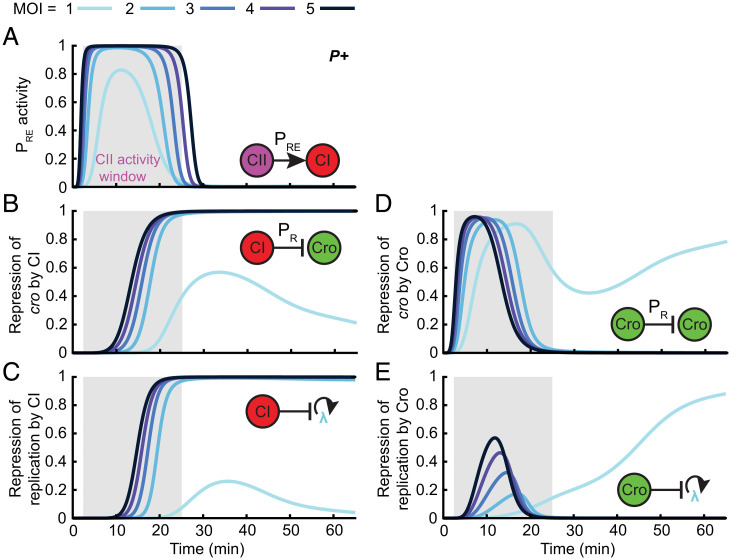
Fig. 4.
CII activation of PRE defines a time window for the network’s response to MOI. (A) Model-predicted PRE promoter activity (per phage) following infection by P+ phage at MOI = 1 to 5. Gray shading indicates the MOI-averaged CII activity window defined as the period during which PRE activity is greater than 10% of its maximum. (B) The strength of cro repression by CI calculated as the magnitude of the CI repression term in the PR transcription rate following infection by P+ phage at MOI = 1 to 5. (C) The strength of repression of replication by CI calculated as the magnitude of the CI repression term in the viral replication rate following infection by P+ phage at MOI = 1 to 5. (D) The strength of cro repression by Cro calculated analogously to the term in B. (E) The strength of repression of replication by Cro calculated analogously to the term in D. Refer to SI Appendix for detailed information.

