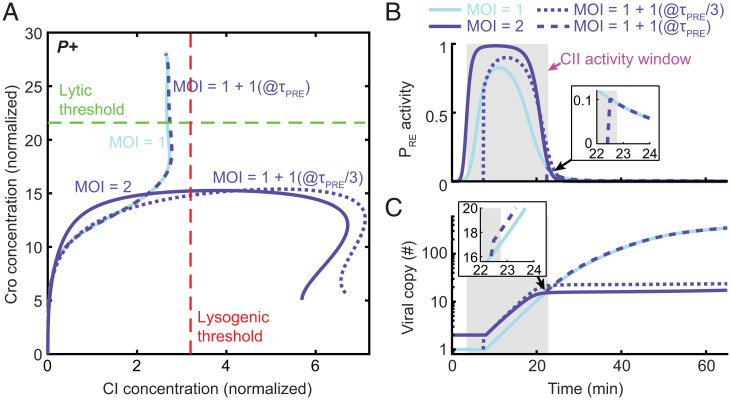
Fig. 5.
Changes in viral copy number outside the CII activity window do not alter the decision. (A) Model-predicted system trajectories in the plane of Cro and CI concentrations (normalized as in Fig. 3) during the first 65 min following infection by P+ phages at four different scenarios: infection by a single phage (solid line, light blue), infection by a single phage followed by a second phage at time τPRE/3 (with τPRE the end of the CII activity window at MOI = 1; dotted line, dark blue) and τPRE (dashed line, dark blue), and simultaneous infection by two phages (solid line, dark blue). (B) PRE activity from the second arriving phages for the cases modeled in A. The shaded gray region indicates the CII activity window at MOI = 1. (Inset) Infection by a second phage at time τPRE. (C) Viral copy number over time for the cases modeled in A. (Inset) Infection by a second phage at time τPRE. Refer to SI Appendix for detailed information.

