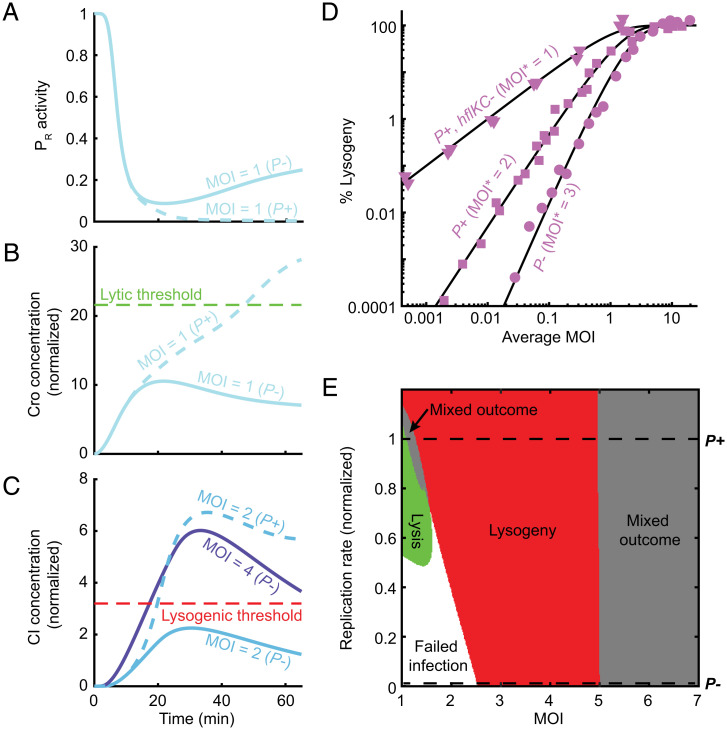
Fig. 6.
Replication is required for the lytic outcome and lowers the MOI required for lysogeny. (A) Model-predicted PR activity per phage during P− (solid blue line) and P+ (dashed blue line) infection at MOI = 1. (B) Cellular Cro concentration (normalized as in Fig. 3) for the cases modeled in A. (C) Cellular CI concentration (normalized as in Fig. 3) during P− infection at MOI = 2 and 4 (solid light and dark blue lines, respectively) and during P+ infection at MOI = 2 (dashed line). (D) The fraction of cells undergoing lysogeny as a function of average MOI during bulk infection with P− (circles), P+ (squares), and phages with prolonged CII lifetime (P+ phages infecting hflKC− hosts; triangles). The experimental data were normalized and fitted to a model (black lines) in which virus–cell encounters follow Poisson statistics, and infection at MOI ≥ MOI* results in lysogeny (10) as described in SI Appendix. The hflKC− strains are either ΔhflK or ΔhflC (SI Appendix, Table S1). (E) Predicted infection outcome as a function of MOI and viral replication rate (normalized by the fitted replication rate of P+ phage). Refer to SI Appendix for detailed information.

