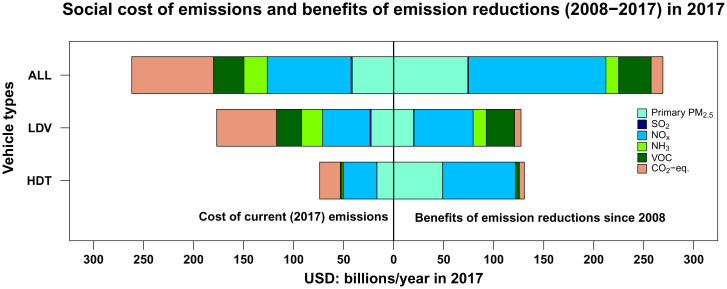
Fig. 2.
Social cost of emissions in 2017 (Left) and benefits achieved since 2008 (Right) for GHGs and each air pollutant. If vehicles were emitting per mile as they were in 2008, benefits would not have occurred and impacts in 2017 would have been represented by the full bars (i.e., benefits shown on right side of the graph represent avoided costs; had those costs occurred, they would have been added to social costs of emissions in 2017).

