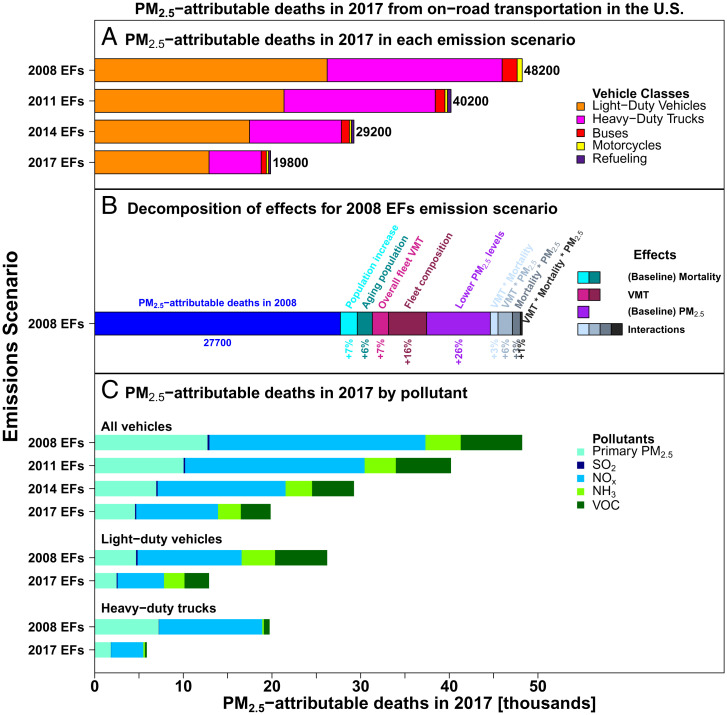
Fig. 3.
PM2.5-attributable deaths caused by vehicle emissions in 2017, in each of the four vehicle emissions scenarios. A shows the impacts by vehicle class. B shows the decomposition of effects over the 2008 to 2017 period, for the 2008 EFs scenario. C shows the impacts for each pollutant for the entire fleet as well as separately for LDVs and HDTs.

